Open topic with navigation
Attributes for Chart Widgets
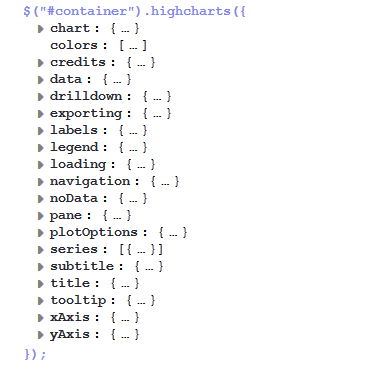
Chart widgets use the Highcharts library. All attributes are JSON objects.
The attributes which can be set comprise:
- General attributes like visibility.
- The basic configuration options of the Highcharts library. Their values ...
- can be set using the page customization attributes.
- can be set using the Admin Tool script which is associated with the chart widget, see section above. The attributes have to be returned as a HashMap.
- can be left empty.
Figure 120: Highcharts configuration options
General attributes:
- localization
Localized values, i.e., "de: {subject:'Thema', yes:'Ja'}, en: {subject:'Subject', yes:'Yes'}".
- visible
Defines if the widget is displayed, true or false.
Highchart-specific attributes:
- chart
Options regarding the chart area and plot area as well as general chart options (http://api.highcharts.com/highcharts#chart). Example:chart = "type:'column', pltShadow:false, backgroundColor:'#4dc245', height:
300";"items: [{html:'sometext', style: { left: '100px'; }}]"
Code example 6: Chart object
- colors
An array containing the default colors for the chart's series. When all colors are used, new colors are pulled from the start again. Defaults to: http://api.highcharts.com/highcharts#colors
- credits
Highchart, by default, puts a credits label in the lower right corner of the chart. This can be changed using these options: http://api.highcharts.com/highcharts#credits
- drilldown
Options for drill down, the concept of inspecting increasingly high resolution data through clicking on chart items like columns or pie slices (http://api.highcharts.com/highcharts#drilldown).
- exporting
Options for the exporting module (http://api.highcharts.com/highcharts#exporting).
- global
Global options that don't apply to each chart (http://api.highcharts.com/highcharts#global). Can only be set for a type, i.e., for chartWidget or tableWidget, not for scopes or single widgets!
- labels
HTML labels that can be positioned anywhere in the chart area (http://api.highcharts.com/highcharts#labels).labels = "items: [{html:'sometext', style: { left: '100px'; }}]"
Code example 7: Labels object
- lang
Language object. The language object is global and it can't be set on each chart initiation (http://api.highcharts.com/highcharts#lang). Can only be set for a type, i.e., for chartWidget or tableWidget, not for scopes or single widgets!
- legend
The legend is a box containing a symbol and name for each series item or point item in the chart (http://api.highcharts.com/highcharts#legend).
- loading
The loading options control the appearance of the loading screen that covers the plot area on chart operations (http://api.highcharts.com/highcharts#loading)
- localization
Localized values, i.e., "de: {subject:'Thema', yes:'Ja'}, en: {subject:'Subject', yes:'Yes'}".
- navigation
A collection of options for buttons and menus appearing in the exporting module (http://api.highcharts.com/highcharts#navigation).
- noData
Options for displaying a message like "No data to display" (http://api.highcharts.com/highcharts#noData).
- pane
Applies only to polar charts and angular gauges. This configuration object holds general options for the combined X and Y axes set (http://api.highcharts.com/highcharts#pane).
- plotOptions
The plotOptions is a wrapper object for config objects for each series type (http://api.highcharts.com/highcharts#plotOptions).
- series
The actual series to append to the chart (http://api.highcharts.com/highcharts#series).
- subtitle
The chart's subtitle (http://api.highcharts.com/highcharts#subtitle).
- title
The chart's main title (http://api.highcharts.com/highcharts#title).
- tooltip
Options for the tool tip that appears when the user's mouse hovers over a series or point (http://api.highcharts.com/highcharts#tooltip).
- visible
Indicates whether the widget is shown.
- xAxis
The X axis or category axis (http://api.highcharts.com/highcharts#xAxis).
- yAxis
The Y axis or value axis (http://api.highcharts.com/highcharts#yAxis).
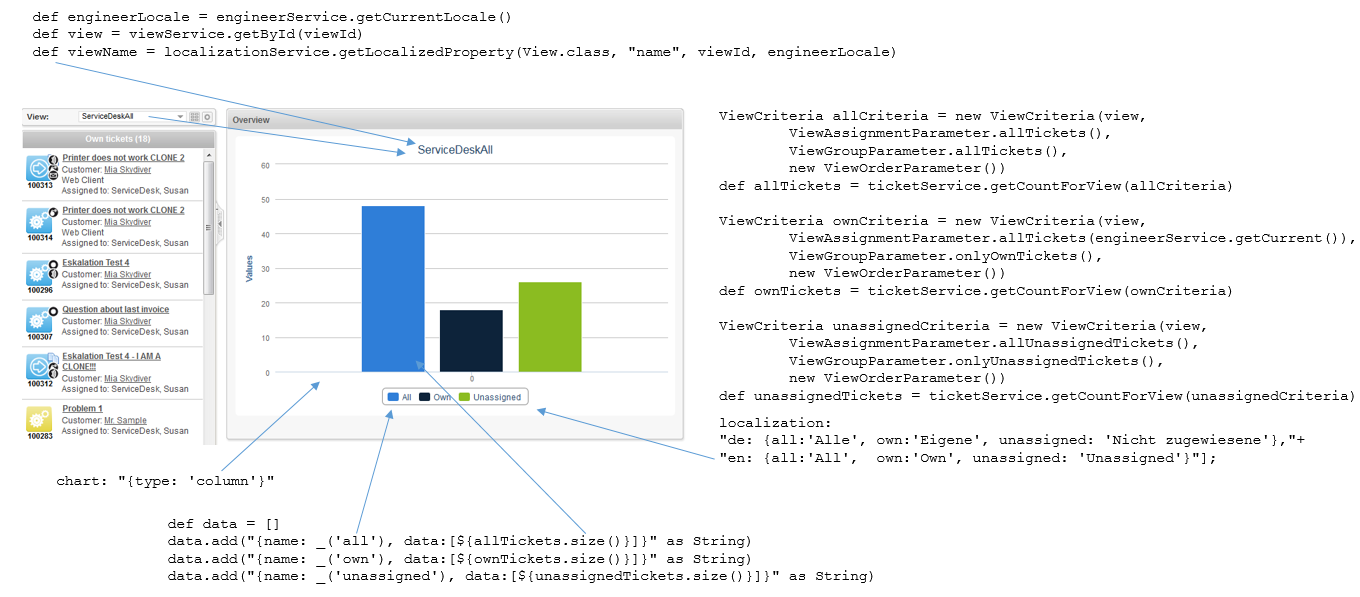
Example of a Chart Widget
The following example shows the widget TicketsInView and explains the logic of the associated Admin Tool script ticketsInViewDataWidget.groovy. For the entire script, please see the code block above. Here, the lines of code are set in relation to the GUI elements which they configure.
Figure 121: Chart widget example with script code