Scripts of the type Field visualization
Scripts of the type Field visualization enable to customize the display of field content in the Web Client and CM/Track. In addition, they allow to display other content on case, contact and resource pages in the Web Client and on case pages in CM/Track.
Examples for the use of field visualization scripts:
- Changing the color, font size or background color of data fields to highlight important information
- Organizing data fields in several groups with headlines
- Displaying maps
- Displaying tables with additional features
- Displaying graphs
Field visualization scripts can use resources, e.g., images, stylesheets, JavaScript libraries, or other files, which are stored in the file system. Alternatively, the resources can also be retrieved using URLs.
Steps to use a field visualization script:
-
Save the required resources in a folder called resources within the ConSol CM data directory.
-
Write a script of the type Field visualization on the Scripts page of the Web Admin Suite. See Writing the field visualization script.
-
Configure the data field:
- Create a data field of the desired type.
- Set Field visualization script for the data field and select a script of the type Field visualization.
- Optional: Set Render field visualization for empty field for the data field if the field visualization script should be executed if the field has no content. Otherwise, the visualization content is only rendered if the field has a value.
- Optional: If the field visualization script displays content with position: absolute, you need to set Allow absolute position for the data field. The visualization content can then be displayed anywhere within the current object (i.e. case, contact or resource). The field label is hidden automatically.
Writing the field visualization script
Field visualization scripts have to implement two methods:
- render()
Includes the logic for rendering the field value. Returns the content to be displayed in HTML syntax. - resources()
Allows to include additional resources. The resources can be stored in the file system. A new folder resources can be created in the ConSol CM data directory for this purpose. Alternatively, resources can also be retrieved using URLs.
The methods provide several parameters:
- pContext: object from which the script is called
- pFieldKey: key of the field which calls the script
- pFieldValue: value of the field
- pClient: type of client, can be web, track, or rest
These parameters allow you, for example, to adapt the behavior to the field value or to configure a different behavior for the Web Client and CM/Track. You can use the method pContext.getPageContext() to implement a different behavior according to the type of page where the field visualization is displayed (TICKET, UNIT or RESOURCE).
Coding example: Display a chart
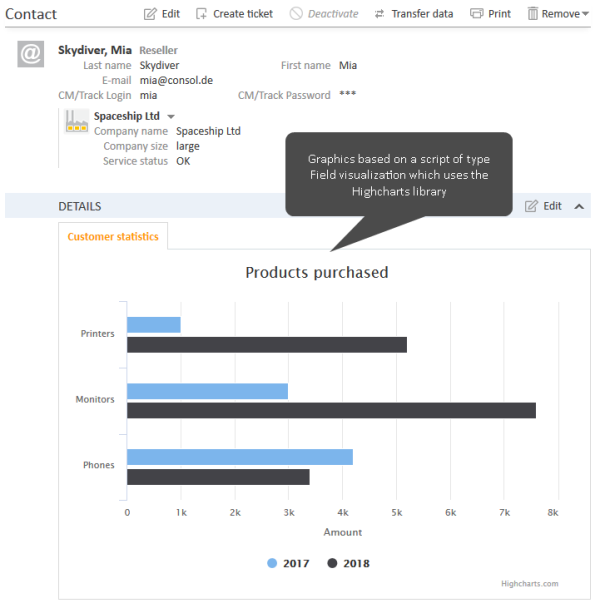
You can use a field visualization script to display graphics like statistics data or small reports. The Highcharts library is used for rendering the data.
In the following example, a contact field, positioned in the Details section, displays statistics. The example uses fixed values in the script, in real life you work with values which are retrieved from real data.
Figure 15: ConSol CM Web Client - Field visualization rendering a graph on a contact page
The following example shows the relevant excerpts of an example script which uses static values.
import com.consol.cmas.common.model.customfield.meta.FieldKey;
import com.consol.cmas.common.model.customfield.visualization.FieldVisualizationContext;
def render(FieldKey pFieldKey, Object pFieldValue, String pClient, FieldVisualizationContext pContext) {
return """
<div id="container" style="width:100%; height:400px;"></div>
<script>
\$(function () {
var myChart = Highcharts.chart('container', {
chart: {
type: 'bar'
},
title: {
text: 'Products purchased'
},
xAxis: {
categories: ['Printers', 'Monitors', 'Phones']
},
yAxis: {
title: {
text: 'Amount'
}
},
series: [{
name: '2017',
data: [1000, 3000, 4200]
}, {
name: '2018',
data: [5200, 7600, 3400]
}]
});
});
</script>
""" as String
}
def resources(FieldKey pFieldKey, Object pFieldValue, String pClient, FieldVisualizationContext pContext) {
List<String> resources = [
"https://code.highcharts.com/highcharts.js"
] as String[];
return resources;
}
Code example 7: Script to display a graph with static data based on the Highcharts library
