Dashboards
Introduction to dashboards in ConSol CM
Dashboards allow to display graphical information in the Web Client. This can be statistics, highlighted system data or any other information which is helpful for the users in their daily work. The content of a dashboard is configured using widgets. Dashboards are available on the general welcome page and the resource overview page.
Concepts, terms and definitions
|
Concept |
Other terms |
Definition |
|---|---|---|
|
dashboard |
|
Web Client screen which shows one or several widgets to provide an overview of important data |
|
widget |
|
Dashboard item which shows data or provides a specific functionality |
Purpose and usage
Dashboards are used to show important information in a graphical way to the users. They are used in two places of the Web Client:
- Welcome page:
This dashboard is displayed right after logging in to the Web Client. By default, it shows a bar chart with the number of cases in the current view. - Resource overview page:
This dashboard is displayed after clicking the Resource pool link in the main menu. It shows a bar chart with the number of resources of the different resource types in each resource category.
The dashboards can be customized using widgets. There are several widgets types which allow displaying different kinds of information, see Available widgets. Widgets can contain interactive elements. Most of the widgets require a widget script which retrieves the required data, see Scripts of the type Widget.
By default, the dashboards are displayed to all users. If you want to adapt the dashboard content to the user’s roles, you need to add the corresponding logic to the dashboard and / or widget scripts, see Adapting the dashboard to the user’s role.
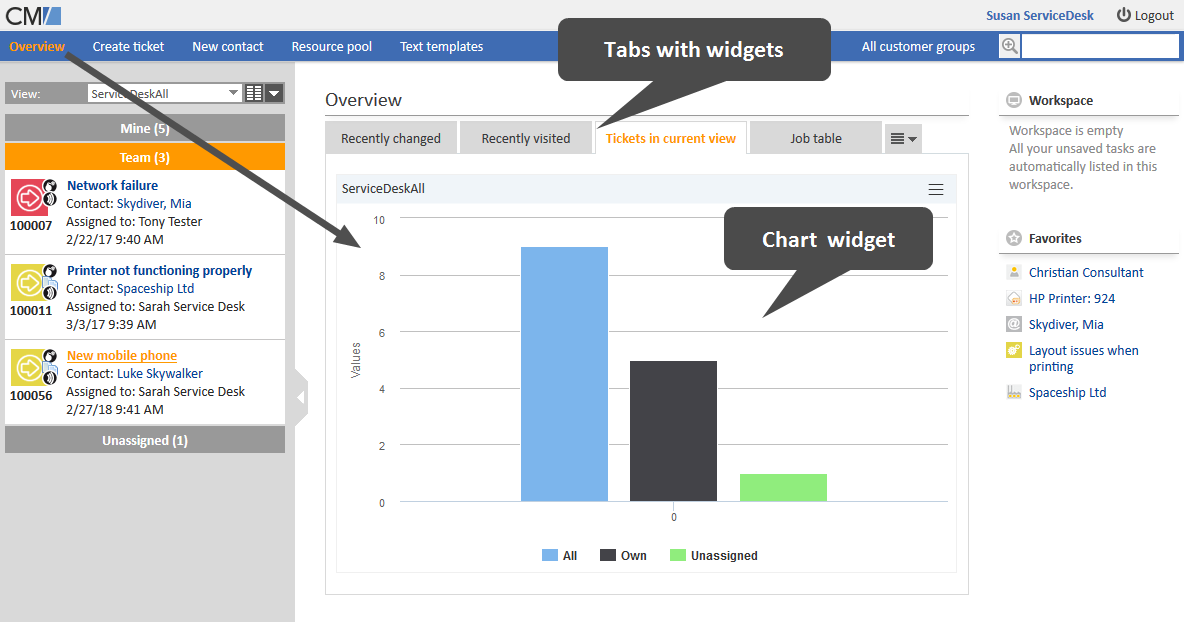
The following figure shows a dashboard which contains several widgets in tabs. The currently selected tab shows the default chart widget with the cases in the current view.
Available widgets
The following widget types are available:
|
Name |
Type |
Description |
Script required |
|---|---|---|---|
|
Calendar |
Calendar |
Displays an integrated Microsoft Outlook calendar, see Calendar widgets and Microsoft Exchange calendars. |
Yes |
|
Chart |
Chart |
Displays a chart, see Chart widgets |
Yes |
|
HTML |
Generic |
Displays HTML content, see HTML widgets |
Yes |
|
KPI |
kpi |
Displays KPIs in colored boxes with a trend indicator, see KPI widgets |
Yes |
|
News |
News |
Displays news, see News widgets |
Yes |
|
Recent changes |
RecentChanges |
Displays a list of objects which have been changed recently, see Recent changes widgets |
No |
|
Recently visited |
RecentlyVisited |
Displays a list of the objects which the current user has viewed recently, see Recently visited widgets |
No |
|
Table |
Table |
Displays a table, see Table widgets |
Yes |
Basic tasks
Defining the dashboard layout
The overall layout of the dashboards is defined using the page customization, see Page customization. The following attributes are used:
- Welcome page: widgetsGrid / welcomePage, accessible when the menu item Overview has been opened
- Resource overview page: widgetsGrid / resourceDashboard, accessible when the menu item Resource pool has been opened
The following general principles apply when defining the dashboard layout:
- Each row of the dashboard grid is represented as an array of elements. The rows are separated by a coma. The grid starts with the upper left corner.
Example: [a,b,c],[d,e,f] - A widget is described by its name and its type, separated by a colon. The name for a specific widget must be unique. See Available widgets for a list of the widget types.
Example: ticketsInView:Chart - The widget can occupy multiple adjacent rows and columns. The type of a widget has to be indicated only at the first appearance of the widget’s name. Afterwards, it can be omitted.
Example: [ticketsInView:Chart, ticketsInView, ticketsInView] - null is a reserved key word for an empty cell.
- You can distribute the widgets in several tabs. There is one array for each tab.
Example: [tabName:'Tickets in current view',widgets:[ticketsInView:Chart]] - The tab name can be localized using the i18n attribute. It is then displayed in the language which the user has set in the browser.
Example: [tabName:'Tickets in current view',i18n:{en:'Tickets in current view',de:'Tickets in der aktuellen Sicht'},widgets:[ticketsInView:Chart]] - The dashboard can be completely disabled by removing the value from the layout attribute.
Please proceed as follows to define the overall layout of a dashboard.
- Log in as an administrator.
- Open the page with the dashboard which you want to edit in the Web Client.
- Open the page customization by clicking the Page customization link in the menu bar.
- Locate the page customization scope widgetsGrid / welcomePage or widgetsGrid / resourceDashboard.
- Edit the value of the layout attribute.
- If all the widgets should be displayed on the same page, add one array for each row and fill the arrays with the widget references.
- If you use tabs, create one array for each tab. The widgets attribute within the tab contains one array for each row. Add the localized tab name to the i18n attribute if needed.
- Save your changes by clicking the Create or Update button in the page customization.
- Reload the page.
- Open the page customization again to configure the widgets, see Configuring widgets.
The attribute refreshOnViewChange allows to determine whether the dashboard should be refreshed when the user changes the view of the case list. The default value is true, i.e. the dashboard is refreshed when the view changes.
The following examples show different layouts.
Layout example 1 - Widget covering several cells
Three widgets are displayed, two charts and one table.
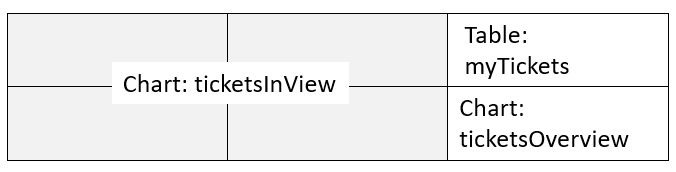
Value of the layout attribute:
[ticketsInView:Chart, ticketsInView, myTickets:Table], [ticketsInView, ticketsInView, ticketsOverview:Chart]
Layout example 2 - Different number of widgets per row
Four widgets are displayed, two KPI widgets, one chart and one table.
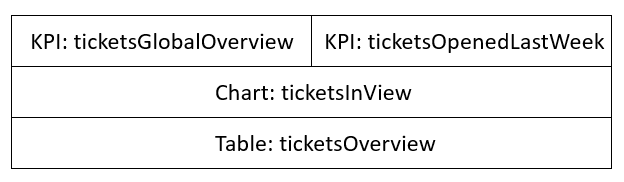
Value of the layout attribute:
[ticketsGlobalOverview:KPI,ticketsOpenedLastWeek:KPI],[ticketsInView:Chart],[ticketsOverview:Table]
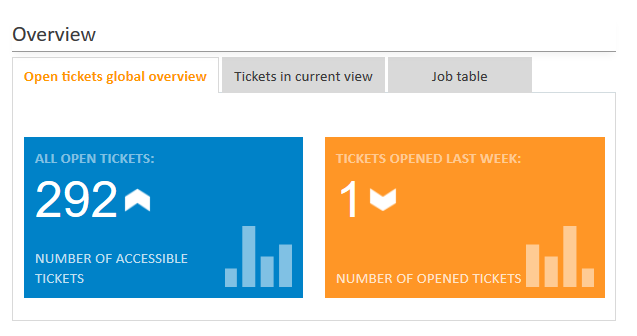
Layout example 3 - Tabs with localized names
The following example shows a dashboard which consists of three tabs with localized names. The first tab contains two KPI widgets, the second tab a chart widget and the third tab a table widget.
Value of the layout attribute:
[tabName:'Open tickets global overview',i18n:{en:'Open tickets global overview',de:'Übersicht offene Tickets'},widgets:[ticketsGlobalOverview:KPI,ticketsOpenedLastWeek:KPI]],[tabName:'Tickets in current view',i18n:{en:'Tickets in current view',de:'Tickets in der aktuellen Sicht'},widgets:[ticketsInView:Chart]],[tabName:'Job table',i18n:{en:'Job table',de:'Tabelle Jobs'},widgets:[ticketsOverview:Table]]
Display in the Web Client, with English browser locale:
Configuring widgets
The following general principles apply when configuring individual widgets:
- You can only edit the widgets which are shown on the page when the page customization is opened. If the dashboard has several tabs, you need to open the tab with the desired widget before starting the page customization.
- Each widget has a node in the subtree of its widget type.
Example: chartWidget / welcomePage / ticketsInView. - The attributes for each widget type can be either defined for the individual widget (e.g., chartWidget / welcomePage / ticketsInView) or for all widgets of the widget type (e.g., chartWidget or chartWidget / welcomePage). Settings on a deeper level overwrite the settings on an upper level, i.e., settings for individual widgets overwrite the settings for the widget type.
Please proceed as follows to configure a widget:
- Add the (empty) widget to the dashboard, see Defining the dashboard layout.
- Open the page with the dashboard which includes the widget in the Web Client. If your dashboard uses tabs, you need to select the tab where the widget is placed.
- Open the page customization by clicking the Page customization link in the menu bar.
- Locate the page customization scope of the widget, e.g. chartWidget/ welcomePage / ticketsInView.
- If the widget type requires a script, create the script and reference it in the page customization. The place where the script is referenced depends on the widget type:
- Calendar: attribute calendarInitializationScript, script type Calendar integration, see Microsoft Exchange calendars
- Chart, KPI, table: configuration script field at the top of the page customization, script type Widget, see Scripts of the type Widget
- HTML: attribute visualizationScript, script type Widget visualization, see Scripts of the type Widget visualization
- News: attribute scriptName, script type News publisher, see Scripts of the type News publisher
-
Set the required values in the attributes of the page customization. You need to set the attribute visible to true for the widget to be displayed.
You can set attributes both in the widget script and in the page customization. The values set in the script overwrite the values entered in the page customization.
Please see the section of the respective widget type for details about the available attributes.
Localizing widget text
You can localize the text displayed in the widget using the localization attribute of the widget configuration. It can be set either in the page customization or in the widget script. The localization attribute can hold the localized values for all string attributes used in the widget.
Please proceed as follows to define localized strings in the page customization:
-
Enter a placeholder in the following syntax as a value for the attribute which you want to localize.
Example: attribute: title, value: _('titlestring')
-
Provide localizations in the following syntax in the localization attribute.
Example: attribute: localization, value: de:{titlestring:'Offene Vorgänge'}, en:{titlestring:'Open cases'}
You can add localizations for different attributes as a comma-separated list within the language tag: de:{titlestring:'Offene Vorgänge',footerstring:'Anzahl bearbeitbare Vorgänge'}
Please proceed as follows to define localized strings in the widget script:
-
Use placeholders in the following syntax when aggregating data for the widget (highlighted in red):
data.add("{name: _('all'), data:[${allTickets}]}" as String)
data.add("{name: _('own'), data:[${ownTickets}]}"as String)
data.add("{name: _('unassigned'), data:[${unassignedTickets}]}"as String)
-
Provide localizations in the return statement using the following syntax (highlighted in red):
localization:"de: {all:'Alle',own:'Eigene',unassigned:'Unzugewiesene'},"+ "en: {all:'All', own:'Own', unassigned: 'Unassigned'}"];
Advanced tasks
Adapting the dashboard to the user’s role
There are two options to adapt the dashboard for different users:
- Show or hide individual widgets
- Show or hide tabs
If you want to display different widgets for different kinds of users, you need to set the visibility attribute of the widget within the widget script. This allows you to display the widget only to the users who have a certain role.
The following example shows how to hide the widget if the current user does not have the consultant role.
def role = roleService.getById('consultant');
def engineer = engineerService.getById(engineer_id);
if(!getRolesForEngineer(engineer).contains(role))
{
return ["visible": false]
}
Code example 38: Widget visibility depending on the user’s roles
If you want to display different tabs for different kinds of users, you need to modify the layout attribute of the dashboard in a script. This is done by creating a page customization script and referencing it in the configuration script field at the top of the page customization.
The following example shows how to display a different set of tabs if the current user has the sales role.
def role = roleService.getById('sales');
def engineer = engineerService.getById(engineer_id);
if (getRolesForEngineer(engineer).contains(role)) {
configuration.put("layout",
"[tabName:'Sales performance', widgets:[sales:Chart]]," +
"[tabName:'Most important leads', widgets:[leads:Table]]");
} else {
configuration.put("layout",
"[tabName:'Service summary', widgets:[service:Chart]]" +
"[tabName:'HelpDesk performance', widgets:[hd:Chart]]");
}
return configuration;
Code example 39: Dashboard layout depending on the user’s roles