Relation graphs
Introduction to relation graphs in ConSol CM
Relation graphs are a way to visualize relations between cases, contacts and resources in ConSol CM. They can be displayed in all Web Client sections which contain relations. In addition, it is possible to create a dedicated section with a customized relation graph.
Concepts, terms and definitions
|
Concept |
Other terms |
Definition |
|---|---|---|
|
relation |
|
Connection between two objects in ConSol CM. The objects can be of the same or of different types. |
Purpose and usage
The content of Web Client sections containing relations can be displayed either as a list or as a graph. The user can select a display mode by clicking the Graph or List link in the section header.
Relation graphs show the relations of the current object (case, contact or resource) as a graph, i.e. each object is a node indicated by an icon and there are edges between the related objects. The nodes and edges have labels to indicate the object and kind of relation.
Relation graphs have the following purposes:
- Provide an alternative way of displaying relations.
- Enhance the provided information, e.g. by showing second-level relations.
Relation graphs are based on the Network library of vis.js, see https://visjs.github.io/vis-network/docs/network/.
The following figures show the Relations section of a case in list and graph mode. In the graph mode, a case which is not related to the current case but to a related case is also shown.
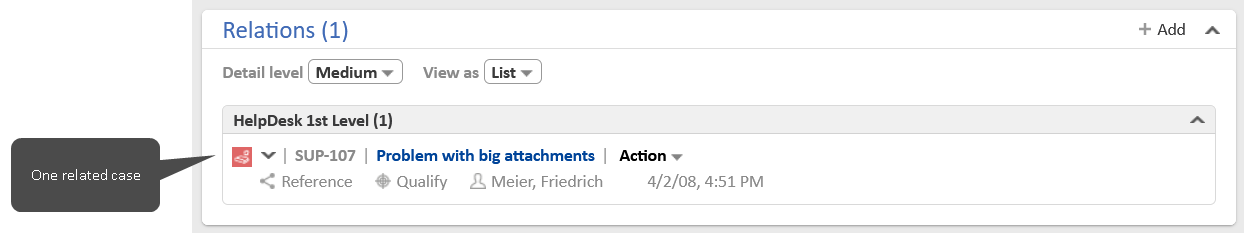
Figure 23: ConSol CM Web Client - Regular display of the section with related cases
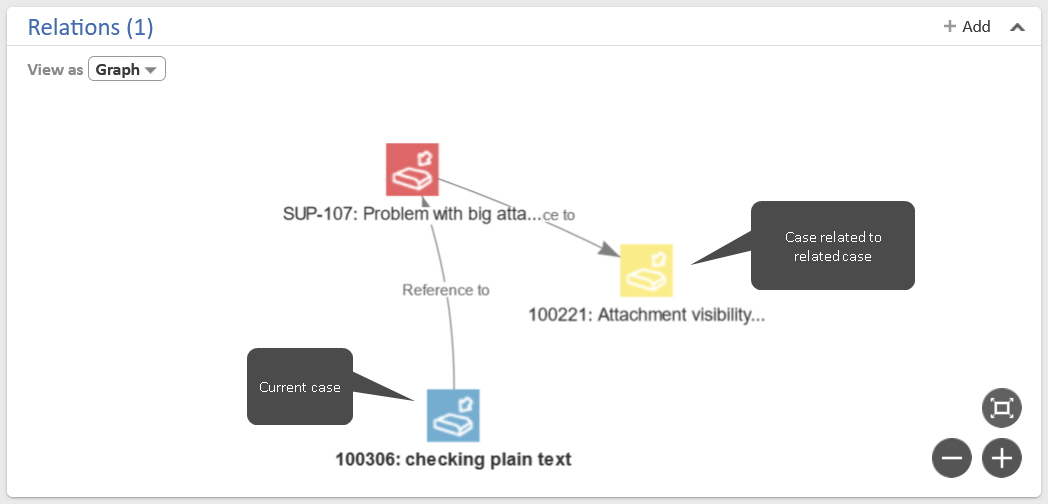
Figure 24: ConSol CM Web Client - Graph displayed in the section with related cases
Available settings
Sections to display relations graphs
Relation graphs are available for all sections which contain relations.
- Cases:
Contacts, related cases and resources - Contacts:
Cases, persons of the company, related contacts and resources - Resources:
Related cases, contacts and resources
The graph display can be enabled in the page customization, see Enabling relation graphs. By default, it shows the direct relations between the current object and other objects and some second-level relations. You can extend and change the display, see Modifying a relation graph.
You can add a custom section with a relation graph to case, contact and resources pages. The content of this graph is not predefined, you need to provide it in a script, see Adding a custom section with a relation graph.
Available configuration parameters
The following attribute are is available for most kinds of relations:
-
maximumStepsFromRoot:
Indicates the number of levels. Examples:"maximumStepsFromRoot" : 1;
Only objects which are directly related to the current object are displayed.
"maximumStepsFromRoot" : 2;
First and second-level relations are displayed, i.e. the objects which are directly related to the current object and the objects which are related to the related objects.
-
relation:
Indicates the type of relation. The values are either fixed (see next section), or depend on the defined relation types. In the latter case, the technical name of the relation definition is used.
Relations on case pages
-
Relations to other cases:
"ticketTickets" : {
"maximumStepsFromRoot" : 2,
"relations" : [ "reference", "parent", "child", "master", "slave" ],
"includedQueues" : [ "queue1", "queue2" ],
"excludedQueues" :[ "queue1", "queue2" ]
}
The following relation types are possible:
- reference: case references the current case
- parent: case is the parent case (fixed) of the current case
- child: case is a child case (fixed) of the current case
- master: case is the parent case of the current case
- slave: case is a child case of the current case
Use either includedQueues or excludedQueues to indicate the technical names of the queues whose cases should be included or excluded.
-
Case contacts:
"ticketCustomers" : {
"maximumStepsFromRoot" : 2,
"relations" : [ "main", "default", "contactTicketRoleName" ],
"includedCustomerGroups" : [ "customerGroup1", "customerGroup2" ],
"excludedCustomerGroups" : [ "customerGroup1", "customerGroup2" ]
}
The following relation types are possible:
- main: contact is the main contact of the case
- default: contact is an additional contact without role
- technical name of the contact role
Use either includedCustomerGroups or excludedCustomerGroups to indicate the technical names of the customer groups whose contacts should be included or excluded.
-
Relations to resources:
"ticketResources" : {
"maximumStepsFromRoot" : 2,
"relations" : [ "related", "resourceRelationDefinition" ],
"includedResourceTypes" : [ "resourceType1", "resourceType2" ],
"excludedResourceTypes" : [ "resourceType1", "resourceType2" ]
}
The following relation types are possible:
- related: any kind of relation.
- technical name of the relation definition
Use either includedResourceTypes or excludedResourceTypes to indicate the technical names of the resource types whose resources should be included or excluded.
Relations on contact pages
-
Cases of the contact:
"customerTickets" : {
"maximumStepsFromRoot" : 2,
"relations" : [ "main", "default", "contactTicketRoleName" ],
"includedQueues" : [ "queue1", "queue2" ],
"excludedQueues" : [ "queue1", "queue2" ]
}
The following relation types are possible:
- main: contact is the main contact of the case
- default: contact is an additional contact without role
- technical name of the contact role
Use either includedQueues or excludedQueues to indicate the technical names of the queues whose cases should be included or excluded.
-
Relations to other contacts:
"unitUnits" : {
"maximumStepsFromRoot" : 2,
"relations" : [ "unitRelationDefinition1", "unitRelationDefinition2" ],
"includedCustomerGroups" : [ "customerGroup1", "customerGroup2" ],
"excludedCustomerGroups" : [ "customerGroup1", "customerGroup2" ]
}
The type of relation is indicated by the technical name of the relation definition.
For directional relations, it is possible to specify the direction, i.e., whether the objects linked in the graph should be source or target of the relation. The syntax is as follows:
The linked contacts are the source of the relation and the root node is the target:
"relations" : [ "unitRelationDefinition:source"]
The linked contacts are the target of the relation and the root node is the source:
"relations" : ["unitRelationDefinition:target"]
Use either includedCustomerGroups or excludedCustomerGroups to indicate the technical names of the customer groups whose contacts should be included or excluded.
-
Company of the person:
"contactCompany" : {
"maximumStepsFromRoot" : 2
}
-
Persons of the company:
"companyContacts" : {
"maximumStepsFromRoot" : 2
}
-
Relations to resources:
"unitResources" : {
"maximumStepsFromRoot" : 2,
"relations" : [ "related", "resourceRelationDefinition" ],
"includedResourceTypes" : [ "resourceType1", "resourceType2" ],
"excludedResourceTypes" : [ "resourceType1", "resourceType2" ]
}
The following relation types are possible:
- related: any kind of relation.
- technical name of the relation definition
Use either includedResourceTypes or excludedResourceTypes to indicate the technical names of the resource types whose resources should be included or excluded.
Relations on resource pages
-
Relations to other resources:
"resourceResources" : {
"maximumStepsFromRoot" : 2,
"relations" : [ "related", "resourceRelationDefinition" ],
"includedResourceTypes" : [ "resourceType1","resourceType2" ],
"excludedResourceTypes" : [ "resourceType1", "resourceType2" ]
}
The following relation types are possible:
- related: any kind of relation.
- technical name of the relation definition
For directional relations, it is possible to specify the direction, i.e., whether the objects linked in the graph should be source or target of the relation. The syntax is as follows:
The linked resources are the source of the relation and the root node is the target:
"relations" : ["resourceRelationDefinition:source"]
The linked resources are the target of the relation and the root node is the source:
"relations" : ["resourceRelationDefinition:target"]
Use either includedResourceTypes or excludedResourceTypes to indicate the technical names of the resource types whose resources should be included or excluded.
-
Relations to contacts:
resourceUnits" : {
"maximumStepsFromRoot" : 2,
"relations" : [ "related", "resourceRelationDefinition" ],
"includedCustomerGroups" : [ "customerGroup1", "customerGroup2" ],
"excludedCustomerGroups" : [ "customerGroup1", "customerGroup2" ]
}
The following relation types are possible:
- related: any kind of relation.
- technical name of the relation definition
Use either includedCustomerGroups or excludedCustomerGroups to indicate the technical names of the customer groups whose contacts should be included or excluded.
-
Relations to cases:
"resourceTickets" : {
"maximumStepsFromRoot" : 2,
"relations" : [ "related", "resourceRelationDefinition" ],
"includedQueues" : [ "queue1", "queue2" ],
"excludedQueues" : [ "queue1", "queue2" ]
}
The following relation types are possible:
- related: any kind of relation.
- technical name of the relation definition
Use either includedQueues or excludedQueues to indicate the technical names of the queues whose cases should be included or excluded.
Basic tasks
Enabling relation graphs
By default, the relation graphs are disabled, e.g. the Graph link is not shown. Please proceed as follows to enable relation graphs:
- Log in as administrator.
- Open the page where you would like to display a relations graph.
- Click Enable page customization in the main menu.
- Locate the type relationGraph in the page customization section and open the subscope of the section where the graph should be displayed.
- Set the attribute graph to On (the section is displayed as a list by default) or Default (the section is displayed as a graph by default). In both cases, the user can switch the display.
Advanced tasks
Modifying a relation graph
There are two ways to modify a relation graph:
- Provide a JSON statement in the page customization attribute graphConfiguration. This attribute only allows to define the scope of the relation graph, i.e. which relations are displayed. See Available configuration parameters for a list of possible configurations.
- Enter the name of a script of the type Relation graph in the attribute graphScriptName. The script has to return the JSON configuration. The script allows to define both the scope and the layout of the relation graph.
Script coding
The script used to define a relation graph needs to return an object of the class RelationGraph. Use the methods of the class RelationCriteria to define the scope of the graph, i.e. kinds of relations shown and depth (how many levels of relations of related objects). Optionally, you can define the layout of the graph with the classes RelationNode and RelationEdge. The method load() of the class RelationService is needed to load the graph. See the ConSol CM API documentation for further details.
Depending on the page where the graph is displayed, the following objects are implicitly available in the script:
- ticketId (on case pages)
- unitId (on contact pages)
- resourceId (on resource pages)
Adding a custom section with a relation graph
You can add a dedicated section which contains a relation graph to case, contact and resource pages. Please proceed as follows to create such a custom section:
- Log in as administrator.
- Open the page where you would like to add the new section.
- Click Enable page customization in the main menu.
- Locate the type section in the page customization section and open the subscope customRelationGraphSection.
- Set the attribute state to either collapsed or expanded.
- Locate the newly created type customRelationGraph and make the following settings:
- Enter the name of the script of the type Relation graph, which returns the graph configuration, in the attribute graphScriptName.
- Enter the text which should be displayed in the section header in the attribute sectionHeader.
- If needed, modify the height of the section in the attribute sectionHeight, so that the relation graph fits into the section. The default value 0 means that the default height is used.
The displayed graph depends entirely on the provided script, which can access the complete ConSol CM API.
Example script which shows the relations of the current resource and the relations of the related resources:
import com.consol.cmas.common.model.relation.*
//create criteria using java api
def relationCriteria = new RelationCriteria()
.withResourceTickets(new RelationCriteria.ResourceTickets()
.withMaximumStepsFromRoot(2))
.withTicketResources(new RelationCriteria.TicketResources()
.withMaximumStepsFromRoot(2))
.withResourceUnits(new RelationCriteria.ResourceUnits()
.withMaximumStepsFromRoot(2))
.withResourceResources(new RelationCriteria.ResourceResources()
.withMaximumStepsFromRoot(2));
//variables available in script: ticketId, unitId, resourceId (depending on page)
def resource = resourceService.getById(resourceId)
def relationGraph = relationService.load(resource, relationCriteria);
//modify graph nodes, edges and visjs property
for (RelationNode node : relationGraph.getNodes()) {
node.withProperty("font", [size:9,color:"black"]) //change default property
}
for (RelationEdge edge : relationGraph.getEdges()) {
edge.withProperty("font", [size:12, color:"red"]); //change default property
}
relationGraph.withProperty("layout", [improvedLayout:true]) //change default property
return relationGraph;