System monitoring
Introduction
In this section, we explain how to monitor a ConSol CM system using monitoring tools, i.e. how to integrate ConSol CM into a professional IT infrastructure where numerous systems are managed. Some checks can also be done manually using the Admin Tool or Web Admin Suite. For automatic checks, the following hooks can be used:
- System monitoring reports
- Monitoring the ConSol CM server process
- Monitoring the login into the CM clients (Web Client and CM/Track), end-to-end tests
- Using beans to monitor some basic parameters
- Monitoring the log files
Please contact the ConSol CM support or your ConSol CM consultant for information about monitoring ConSol CM in a cluster.
System monitoring reports
Monitoring information can be retrieved using the health check endpoint. The monitoring reports contain information about the configuration of ConSol CM and the operational status of the system components.
Two reports are provided:
- full report: <CM URL>/health/report
- short report: <CM URL>/health/check
The information is retrieved in JSON format. Some sections contain a status (SUCCESS, WARNING) with a description.
The following information is retrieved:
-
Workflow engine
number of job execution threads, number of jobs (active, running, locked, delayed, under retry), transaction timeout, locking limit, timestamp of the latest job execution -
Database
name, version and hibernate dialect, status and speed of test connection, number of available and used connections (only available for JBoss application servers) -
Database performance
This check needs to be executed manually. It creates a temporary table, generates rows in this table and performs select operations in order to test the performance of the database.
The check is configured using the following URL parameters:
- cmas-core-dao-performance.enabled
Determines whether the performance check is enabled. The default value is false. You need to set this parameter to true to activate the performance check. - cmas-core-dao-performance.cleanData
Determines whether the table should be cleared before each run. The default value is true. - cmas-core-dao-performance.threadsNumber
Determines the number of threads used for the performance check. The default value is 10. - cmas-core-dao-performance.rowsPerThread
Determines how many rows are generated by each thread. The default value is 5000. - cmas-core-dao-performance.selectsPerThread
Determines how many selects are performed by each thread. The default value is 100.
The syntax for using the URL parameters is:
<CM URL>/health/report?cmas-core-dao-performance.enabled=true&cmas-core-dao-performance.cleanData=true
After enabling the check, you need to wait a couple of minutes and then retrieve the report again.
- cmas-core-dao-performance.enabled
-
Hardware
total and available memory and disk space, number of processors, CPU usage, system load, time since last boot (in seconds) -
Server information
ConSol CM version, Java version, JavaMail version, status of the SMTP connection, cluster node ID (if the system runs in a cluster) -
Server events
number of cluster members, timestamp and response to test calls -
Email system
mailbox ID, number of queued emails, timestamp of the last connection and processed email, ID of the last processed email -
DWH information
mode, status, date of last transfer, live mode status, date of last live message, statistics -
License information
number of available and currently used licenses for each license pool, days until the first license expires -
Authentication protection
protected endpoints, number of failed attempts in the last hour, configuration
Monitoring tools
You can use a monitoring tool or application of your choice to control the CM systems. We recommend using a Nagios®-based solution. If you would like to get support on that topic, read the ConSol Monitoring page or ask your CM consultant.
Monitoring the ConSol CM server process
ConSol CM is a Java EE application, hence you can monitor the application server process. You can
- Monitor the basic process parameters like CPU usage, see section Using beans to monitor some basic parameters
- Monitor the CM functionality (is login possible?). See the following section.
JMX monitoring using Jolokia
You can use Jolokia to monitor application servers, e.g., memory usage and garbage collection, and you can also check ConSol CM functionalities. As a basis, you have to deploy the file jolokia.war into the application server. Please ask your ConSol CM consultant for support if you would like to use this option.
Monitoring the login into the CM clients (Web Client and CM/Track), end-to-end tests
The default port for the CM web server is 8080. That means, after a CM installation, you can reach the ConSol CM start page under http(s)://<server>:8080. The CM Web Client can be reached under http(s)://<server>:8080/client/login. Of course, if the port has been modified (e.g., by using a port offset), the ports in the monitoring scripts have to be adapted accordingly.
In order to check the client login, you have to create a monitoring user, e.g., nagios in the CM system. This user is created like a regular system user. Use the Admin Tool for this operation. For a detailed introduction to user, i.e., engineer administration, please refer to the ConSol CM Administrator Manual, section Engineer Administration.
Configuring the monitoring user
There is the option to configure a user (engineer/customer) for monitoring CM operations. This user can access each client exactly once using one session. This login will not consume a license. The session created will be marked as monitoring session. The user must independently have proper permissions to perform the tasks required for monitoring. These could include usage of the Admin Tool.
Two configurations have to be performed:
- For the check of the Web Client:
Create an engineer and enter his login name in the system property cmas.core.server, monitoring.engineer.login. - For the check of CM/Track:
Create a contact, assign a CM/Track user profile to him (see section CM/Track in the ConSol CM Administrator Manual), and enter his login name into the system property cmas.core.server, monitoring.unit.login.
Web Client monitoring principle
- Check the login
For the login, the username and password have to be submitted using an HTML POST request. - E.g., call the CM main page
You might want to use the ConSol CM Nagios plugin (a PERL script for Nagios servers) to check the Web Client. Please ask your ConSol CM consultant for more information.
Monitoring CM in a cluster
In a cluster which consists of a load balancer and several CM servers, we recommend to check the login into each of the CM servers as well as the login via load balancer.
URL /logout for automation purposes
The URL for logging out of the Web Client is:
http://<CM_SERVER>/cm-client/logout/
This URL eases automation use cases like monitoring that require login and logout to the Web Client. It provides a robust way to log out of an automated Web Client session again not to unnecessarily consume licenses for monitoring.
Using beans to monitor some basic parameters
To monitor basic application server parameters, e.g., heap, CPU usage or used memory, you can use tools which directly access the JBeans of the application server. As a default in JBoss, use JConsole.

Figure 15: JConsole - Checking basic runtime values for a JBoss CM server
In order to integrate this monitoring into a larger IT environment, you could use, e.g., Jolokia to receive HTML output from the request to the JBeans. This can be inserted into your monitoring environment, e.g., into Nagios using a Perl script.
Checking the status of the indexer
In order to perform effective searches, ConSol CM creates an index for each data field which is either marked as indexed by default or which has been marked as indexed by an administrator. A detailed introduction to the search and indexer is provided in section Index. The indices are stored in the file system, the indexer status is represented by a system property (cmas-core-index-common, index.status).
Checking the indexer file system
The index is located in the data CM directory which has been configured during setup, subdirectory index. You should ...
- control the disk space on this file system.
- control if the file system is available, in case it is mounted from another server.
- control if the synchronization between master and slave servers works in case you work in a server cluster environment.
Checking the indexer status in the database
In order to control the indexer status manually, open the page Index in the Operations menu of the Web Admin Suite, see
To control the status using a monitoring tool, you can check the table cmas_configuration. The system property cmas-core-index-common, index.status should be GREEN.
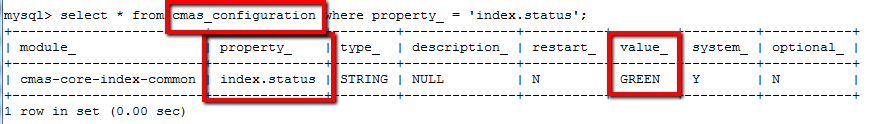
Figure 16: Checking the Indexer status using database access
This property can also be seen on the System properties page of the Web Admin Suite.
In case the status is YELLOW or RED, you have to use the Web Admin Suite to rebuild or repair the index.
Monitoring the log files
For a detailed description of CM log files, please read section Log files.
Tags to monitor
Files and tags which should be monitored
The most important log file is server.log. However, all log files should be controlled. In the file error.log, only errors are reported, so this might also be a good hook for your log file monitoring.
All entries of type ERROR should be analyzed. Please take all possible use cases into consideration to configure which entries should really trigger a system alarm. For example, there might be log entries labeled as ERROR which occur rather often and only show that an access denied event has occurred. So at this point, the monitoring tool has to be adapted in a very specific way for each CM system.
Monitoring email functionalities
Error email configuration
The first step in monitoring email functionalities of ConSol CM is configuring the correct TO addresses for error emails which concern the CM mailing subsystem. This is explained in detail in section Administrator and Notification Email Addresses.
Of course, you can configure TO addresses which belong to a ticketing system (e.g., ConSol CM, incident queue). In this way, you can be sure to get a notification when an e-mail error occurs.
Log file control
Additionally, you can scan the specific log file, to be found in the following path:
<JBOSS_HOME>/standalone/log/mail.log
Control of undeliverable emails
Emails which were fetched by CM but could not be processed further, are stored in the database table cmas_nimh_archived_mail. In the Admin Tool, these email backups are listed under navigation group Email, navigation item Email Backups. In a well-maintained system, this table should be empty.
Emails which could not be saved to the database, e.g., due to their size, are saved in the file system (subfolder /mail/unstorable of the ConSol CM data directory) instead. The administrator receives an email notification.
A detailed explanation is provided in the ConSol CM Administrator Manual, section Email Backups.
CMRF / DWH monitoring
You can carry out the following steps to monitor the CMRF / DWH:
- Check the value of hlp_parameter.dwh_status. It should be 4 (DWH operational). For the explanation of all states see Tables in the DWH (database or database schema).
-
For the live mode, you can get the point in time of the DWH as a timestamp in epoch milliseconds by using the following command:
select * from int_parameter where name ='last-success-live-id';
- Check the cmrf.log file for entries which contain ERROR (maybe also WARNING).
-
You can check if the automatic execution of DWH tasks is active via the CM system property cmas-dwh-server, autocommit.cf.changes.
The CM database (table cmas_dwh_synchronization) and the log files (server.log, cmrf.log) are the best source of information about status and progress. Starting with version 6.11 you can also see the status of the DWH jobs in the task list in the CM Admin tool (navigation group Data Warehouse, navigation item Administration) and the general status of the DWH in the DWH Monitor (navigation group Data Warehouse, navigation item Monitor).
- CM database:
- The table cmas_dwh_synchronization contains information about each operation.
- The column dwh_status contains the status of the processing in CM:
- NEW - first status after creation
- ACTIVE - data is sent to CMRF
- SUCCESS - sending of data to CMRF has been finished successfully
- ERROR - sending of data to CMRF has been finished unsuccessfully
- The column cmrf_status contains the status of the processing in CMRF:
- NEW - first status after creation
- ACTIVE - data is processed in CMRF
- SUCCESS - processing of data has been finished successfully
- ERROR - processing of data has been finished unsuccessfully
- The column dwh_status contains the status of the processing in CM:
- The table cmas_dwh_synchronization contains information about each operation.
- Log files:
- server.log (search for: dwh-transfer-service, dwh-live-service, dwh-log-service)
- cmrf.log