Relation graphs
Case, contact page, and resource page sections which show linked objects (all kinds of relations, contacts of a case, persons of a company, cases of a contact) can be displayed in two modes:
- List: standard display from previous versions of ConSol CM
- Graph: new graph display
You can switch between the list view and the graph view using the List and Graph links next to the section heading. The Graph link is only displayed if the section includes at least one relation.
The objects in the graph are represented by their icons. Two icons representing linked objects are connected with an arrow. When the graph view is selected, there is no counter stating the number of relations in the section header. The lower right corner of the graph includes buttons to zoom in and out and restore the default zoom. A tooltip is displayed when the user hovers over an icon or clicks an icon. Double-clicking an icon opens the page of the respective object. You can use drag-and-drop to move the objects within the graph.
The level of detail displayed in the graph depends on the number of objects and the zoom factor. The graph always shows the icons of the objects and the arrows between related objects. If there is enough space on the canvas, it also includes the description of each object and the type of relation between two objects.
The main purpose of the graph view is providing a better visualization of the relations. Depending on the section, you might have to switch to the list view for managing the relations.
The following figure shows the relation graph for the Contacts section of a case which has a main contact and an additional contact. Note that the description of the root object (the object of the current page, in this case the case), is displayed in bold.
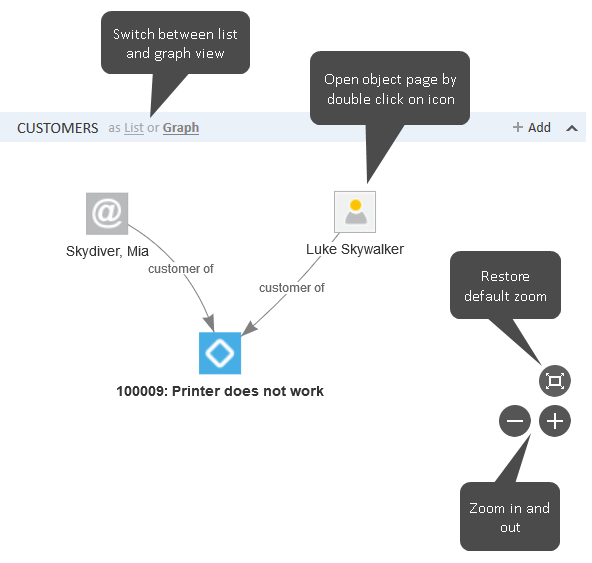
Figure 13: Relation graph in the Contacts section of a case
By default, both the list and the graph show the same relations. Nevertheless, your CM system can be configured to display other relations in the graph view. For example, the list view of the Related Resources section of a case displays the resources which are directly related to the case, while the graph view also displays the contacts which are related to these resources. It is also possible that the layout of the graph is customized.
Depending on the individual configuration of your CM system, cases, contacts, and resources can have an additional section for a customized relation graph. The content of this graph depends on the individual configuration of your CM system.