Page Customization for the Web Client Dashboard
Introduction
The Web Client Dashboard is configured using Page Customization.

Figure 185: ConSol CM Web Client - Web Client Dashboard with several tabs. Open tab with chart widget
Log in as admin, open the Overview page and select Enable page customization in the main menu. The following (Dashboard-relevant) elements can be configured here:
- widgetsGrid / welcomePage
Here, the Web Client Dashboard can be switched on or off. If a correct value is entered in the layout field, the Dashboard is displayed (Attention: If the value is not correct, the Web Client will not start!). If the field is empty, no Dashboard is shown.
The following configuration can be made here:- the Dashboard layout, i.e., the layout of the grid on which the Dashboard is based (see section Definition of the Overall Dashboard Layout, this comprises:
- the widgets which should be displayed
- the order and organization of those widgets on the Dashboard page
- the Dashboard layout, i.e., the layout of the grid on which the Dashboard is based (see section Definition of the Overall Dashboard Layout, this comprises:
- chartWidget / welcomePage (only available if chart widgets are present)
- the definition/layout for all chart widgets in the chartWidget subtree
- each widget is represented by one node which has the name of the widget, e.g., chartWidget / welcomePage / ticketsInView
- a new chart widget is added when its name has been added in the layout value
- attributes can be defined for all chart widgets on the level chartWidget or chartWidget / welcomePage or they can be configured for one chart widget individually using the values of the attributes for the chart widget, e.g., chartWidget / welcomePage / ticketsInView
- tableWidget / welcomePage (only available if table widgets are present)
- the definition of all table widgets in the tableWidget subtree
- each widget is represented by one node which has the name of the widget, e.g., tableWidget / welcomePage / ticketsOverview
- a new table widget is added when its name has been added in the layout value
- attributes can be defined for all table widgets on the level tableWidget or tableWidget / welcomePage or they can be configured for one table widget individually using the values of the attributes for the table widget, e.g., tableWidget / welcomePage / ticketsOverview
-
kpiWidget / welcomePage (only available if KPI widgets are present)
- the definition of all KPI widgets in the kpiWidget subtree
- each widget is represented by one node which has the name of the widget, e.g., kpiWidget / welcomePage / ticketsGlobalOverview
- a new KPI widget is added when its name has been added in the layout value
- attributes can be defined for all KPI widgets on the level kpiWidget or kpiWidget / welcomePage or they can be configured for one KPI widget individually using the values of the attributes for the KPI widget, e.g., kpiWidget / welcomePage / ticketsGlobalOverview
As explained before in section Page Customization each of the four elements is represented by a subtree in the page customization tree. The following figure provides an example page customization tree with subtrees relevant for the Web Client Dashboard. A detailed explanation is provided in the following sections.
Please note that when you work with a tabbed dashboard, only the page customization subtree(s) of the active (i.e. currently opened) tab is/are displayed.

Figure 186: ConSol CM Web Client - Page customization subtrees for Web Client Dashboard layout
Definition of the Overall Dashboard Layout
The overall layout of the entire Web Client Dashboard is defined using the page customization attribute widgetsGrid / welcomePage.
Variant 1: All Widgets Displayed on One Page
Attributes:
- layout
This defines the layout of the entire Dashboard on the welcomePage based on the following principles:- A widget is described by its name and its type, separated by a colon, e.g., 'ticketsInView:Chart'. The name for a specific widget must be unique.
- The type of a widget is Chart or Table. The type has to be indicated only at the first appearance of the widgets name, afterwards, it can be omitted, e.g., [ticketsInView:Chart, ticketsInView, ticketsInView].
- Each row of the Dashboard grid is represented as an array of elements: [x,y,z]. A new widget object will be added to the page customization tree automatically when it is added as value in the layout attribute, e.g., when the value has been [ticketsInView:Chart, ticketsInView] and the value is now [ticketsInView:Chart, ticketsInView, myTickets:Table], another table widget named myTickets will appear in the page customization tree (see figure above) and on the Dashboard. In the same way, widgets can be removed from the Dashboard - just remove the name and type of the widget in the layout value. After saving and reloading the page all layout changes are available in the tree for further configuration.
- The grid starts with the upper left corner (0,0) and it is built up row after row, e.g., a layout value with two pairs of [ ] brackets will represent two rows as shown in the figure and code shown below.
- null is a reserved key word for an empty cell.
- The widget can occupy multiple adjacent rows and columns.
- The Dashboard can be completely disabled in removing the value from the attribute layout.
The following examples show two possible layout configurations and the respective display in the Web Client.
Example 1
Three widgets are displayed, two charts and one table.
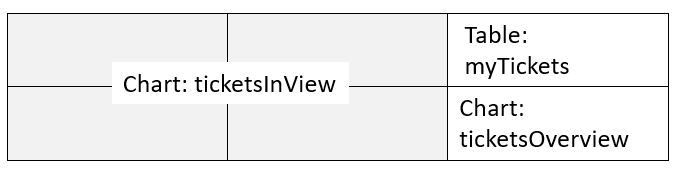
Figure 187: Organization of an example grid of a welcomePage
The value of the respective layout attribute would be:
[ticketsInView:Chart, ticketsInView, myTickets:Table], [ticketsInView, ticketsInView, ticketsOverview:Chart]
Example 2
Four widgets are displayed, two KPI widgets, one chart and one table.
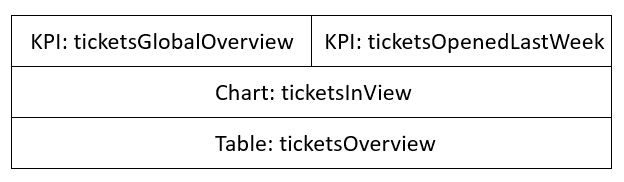
Figure 188: Organization of an example grid of a welcomePage with KPI widgets
The value of the respective layout attribute would be:
[ticketsGlobalOverview:KPI,ticketsOpenedLastWeek:KPI],[ticketsInView:Chart],[ticketsOverview:Table]
The Dashboard page in the Web Client looks as demonstrated in the following figure.

Figure 189: ConSol CM Web Client: Dashboard with four widgets of different types
Variant 2: Tabbed Widgets
The widgets can also be displayed on tabs. In this case, each widget is displayed on a separate tab. The layout attribute is used for this configuration.
Variant 2.1: Using Explicit Headers
The following notation for the value of the layout attribute sets an explicit header for each tab, i.e. the browser locale is not taken into consideration.
[tabName:'Tickets in current view',widgets:[ticketsInView:Chart]],[tabName:'Job table',widgets:[ticketsOverview:Table]]

Figure 190: Setting explicit headers as tab titles
Variant 2.2: Using Localized Headers
The following notation for the value of the layout attribute sets localized headers, i.e. the header depends on the browser locale. In the example, English and German headers are specified. If the browser locale is not set, the default CM locale is used.
Localized Headers, Example 1
[tabName:'Tickets in current view',i18n:{en:'Tickets in current view',de:'Tickets in der aktuellen Sicht'},widgets:[ticketsInView:Chart]],[tabName:'Job table',i18n:{en:'Job table',de:'Tabelle Jobs'},widgets:[ticketsOverview:Table]]

Figure 191: Using localized headers (in the given example en and de, displayed: de)
Localized headers, Example 2
An example of a rather complex dashboard layout with three tabs is shown in the following code and figure
Value for the layout attribute in widgetsGrid/welcomePage:
[tabName:'Open tickets global overview',i18n:{en:'Open tickets global overview',de:'Übersicht offene Tickets'},widgets:[ticketsGlobalOverview:KPI,ticketsOpenedLastWeek:KPI]],[tabName:'Tickets in current view',i18n:{en:'Tickets in current view',de:'Tickets in der aktuellen Sicht'},widgets:[ticketsInView:Chart]],[tabName:'Job table',i18n:{en:'Job table',de:'Tabelle Jobs'},widgets:[ticketsOverview:Table]]
Display in the Web Client, with EN browser locale:

Figure 192: ConSol CM Web Client: tabbed dashboard with two KPI widgets on the first tab
Configuration of Widgets
Configuration Script for Widgets
Each widget has a configuration script. This script is a Groovy script which is stored in the Scripts section of the Admin Tool and is referenced by its name. The scripts has to be of type Widget.This type has been introduced in ConSol CM version 6.11. The value used in previous versions, Page customization, will still work. Select the widget in the PCDS and enter the script name:

Figure 193: ConSol CM Web Client - Script definition for a chart widget

Figure 194: ConSol CM Admin Tool - Admin Tool script for a widget of the Web Client Dashboard
The configuration script of a widget is the place where the statements are defined which retrieve the required data from the CM system and where the widget layout is defined. The execution of this groovy script is a core part of the customization. The script must return a map of variables which correspond to the defined widget properties.
An incorrect script does not provide a data structure which can be displayed by the Web Client Dashboard. Since the Dashboard is displayed on the Overview page which is the start page, the Web Client will not start in those cases! Disable or comment out the script to start the Web Client again.
The script overwrites the configuration data provided in the page customization. The values are not merged! The script will thus override any widget attribute value set in the graphical customization, so please make sure that the desired attribute is not set within the script if you want to use the graphical page customization for attribute setting.
A script which is associated with a widget is usually executed with user (= engineer) permissions, e.g., the standard chart widget shows a graphical representation of the selected view. However, sometimes values have to be used which are not available in the engineer context, e.g., escalated tickets (of all engineers) in a certain queue. In order to execute a script with admin permissions, select the check box run with admin privileges. Please keep in mind that the results of the Java or Groovy methods which retrieve the data will vary depending on the context. For example, the method ticketService.getAll() will return only tickets for which the current engineer has at least read permissions, but will return all tickets in the system when executed as admin.
The chart representation in the Web Client Dashboard is based on the Highcharts library. Thus, for chart widgets, the Admin Tool script has to return a HashMap containing the attributes which should be set (see return statement in the code example below which uses the attributes series, visible, chart, title, tooltip, and localization). A detailed explanation of all attributes and the respective hyperlinks is provided in the section Attributes for Chart Widgets.
The table representation in the Web Client Dashboard is based on the Datatables library. Thus, for table widgets, the Admin Tool script has to return a HashMap containing the attributes which should be set. Please see section Attributes for Table Widgets.
The KPI representation in the Web Client Dashboard is based on the jquery-kpiwidget library. For KPI widgets, the Admin Tool script has to return a HashMap containing the attributed which define the KPI representation. For a detailed explanation, please refer to the section Attributes for KPI Widgets.
Very complex scripts can decrease system performance!
The following example shows the script ticketsInViewDataWidget.groovy which is provided with a standard ConSol CM distribution.
import com.consol.cmas.common.model.ticket.*;
import com.consol.cmas.common.model.ticket.view.*;
import java.util.*;
import java.util.Map.Entry;
if (viewId == -1) {
return [visible: 'false']
}
def engineerLocale = engineerService.getCurrentLocale()
def view = viewService.getById(viewId)
def viewName = localizationService.getLocalizedProperty(View.class, "name", viewId, engineerLocale)
ViewCriteria allCriteria = new ViewCriteria(view,
ViewAssignmentParameter.allTickets(),
ViewGroupParameter.allTickets(),
new ViewOrderParameter())
def allTickets = ticketService.getCountForView(allCriteria)
ViewCriteria ownCriteria = new ViewCriteria(view,
ViewAssignmentParameter.allTickets(engineerService.getCurrent()),
ViewGroupParameter.onlyOwnTickets(),
new ViewOrderParameter())
def ownTickets = ticketService.getCountForView(ownCriteria)
ViewCriteria unassignedCriteria = new ViewCriteria(view,
ViewAssignmentParameter.allUnassignedTickets(),
ViewGroupParameter.onlyUnassignedTickets(),
new ViewOrderParameter())
def unassignedTickets = ticketService.getCountForView(unassignedCriteria)
def data = []
data.add("{name: _('all'), data:[${allTickets}]}" as String)
data.add("{name: _('own'), data:[${ownTickets}]}"as String)
data.add("{name: _('unassigned'), data:[${unassignedTickets}]}"as String)
return [series: "[${data.join(',')}]" as String,
visible: 'true',
chart: "{type: 'column'}", title: "{text: '${viewName}'}" as String,
tooltip:"{headerFormat:''}" ,
localization:"de: {all:'Alle',own:'Eigene',unassigned:'Unzugewiesene'},"+ "en: {all:'All', own:'Own', unassigned: 'Unassigned'}"];
Code example 5: Standard ConSol CM chart widget script ticketsInViewDataWidget.groovy
The following chart is defined by the script above. For a detailed explanation, please refer to the section Example of a Chart Widget.

Figure 195: ConSol CM Web Client - Example chart widget