Configuration of the Web Client Dashboard
Starting with version 6.9.4, the ConSol CM Web Client provides a dashboard for engineers, displayed on the Web Client Overview page. On the dashboard you can display statistical values that show important information about the work areas of your engineers.
The dashboard is composed of one or more so-called widgets. In its default configuration, the dashboard contains only one widget which displays a graphic with the number of tickets in all groups of the selected view. Dashboards can contain interactive elements, e.g., to show or hide elements of the graphic. However, persistent engineer-specific (personal) adaption is not possible.
After an update from a previous version to CM version 6.9.4 and up, the Web Client Dashboard will be disabled.
In a new installation CM 6.9.4 or higher, the Web Client Dashboard will be enabled by default. A default dashboard configuration is provided (see example below).

Figure 97: ConSol CM Web Client - Web Client Dashboard example

Figure 98: ConSol CM Web Client - Interactive widget (fade-in and -out parts of the graphic)
Widgets which are used for the dashboard are of one of three possible types:
- Chart
for graphical representation of data - Table
for table representation of data - KPI
for special representation of key performance indicators
As an administrator you can design the layout of the dashboards as required, i.e., you can place KPI, chart and table widgets on the dashboard page. They are placed on the page based on a grid layout.

Figure 99: ConSol CM Web Client - Example for a dashboard tab with two chart widgets in one column

Figure 100: ConSol CM Web Client - Example for a dashboard tab with two chart widgets in one column
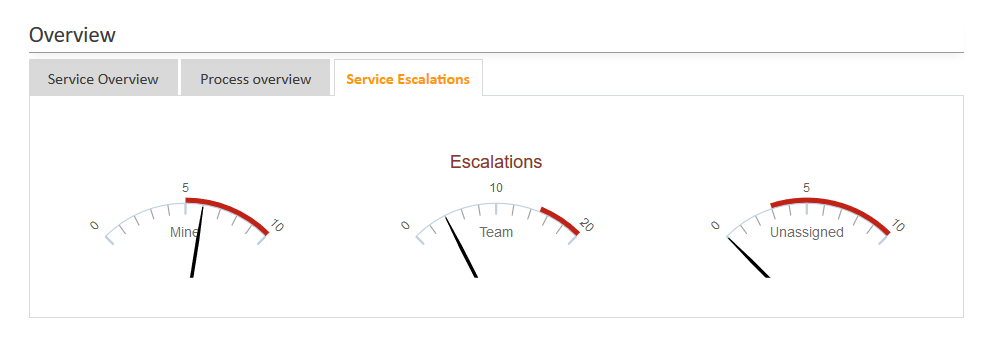
Figure 101: ConSol CM Web Client - Example for dashboard tab with one widget

Figure 102: Example for a dashboard tab with three different widgets in one row
The data for the graphs and/or tables in the widgets are retrieved using Groovy statements which are placed in an Admin Tool script.
The dashboard is configured using Page Customization for the Web Client Dashboard.