Attributes for Chart Widgets
Chart widgets are configured in the type chartWidget or one of its subitems. They use the Highcharts library. All attributes are JSON objects.
The attributes which can be set comprise:
- General attributes like visibility.
- The basic configuration options of the Highcharts library. Their values ...
- can be set using the page customization attributes.
- can be set using the Admin Tool script which is associated with the chart widget, see section above. The attributes have to be returned as a HashMap.
- can be left empty.
General attributes:
- developmentMode
Enables the development mode for the widget. If this attribute is set to true, the widget is displayed with a red border and a JSLint validation is performed on the widget script. If there are errors in the widget script, the error messages are displayed instead of the widget. - localization
Allows to set localized (i.e., country-specific) values for the strings used as values in attributes. Please see section Localization of String Values of Attributes for a detailed explanation. - visible
Defines if the widget is displayed, true or false.
Highchart-specific attributes:
- chart
Options regarding the chart area and plot area as well as general chart options (http://api.highcharts.com/highcharts#chart). Example:chart = "type:'column', pltShadow:false, backgroundColor:'#4dc245', height:
300";"items: [{html:'sometext', style: { left: '100px'; }}]"
- colors
An array containing the default colors for the chart's series. When all colors are used, new colors are pulled from the start again. Defaults to: http://api.highcharts.com/highcharts#colors - credits
Highchart, by default, puts a credits label in the lower right corner of the chart. This can be changed using these options: http://api.highcharts.com/highcharts#credits - drilldown
Options for drill down, the concept of inspecting increasingly high resolution data through clicking on chart items like columns or pie slices (http://api.highcharts.com/highcharts#drilldown). - exporting
Options for the exporting module (http://api.highcharts.com/highcharts#exporting). - global
Global options that do not apply to each chart (http://api.highcharts.com/highcharts#global). Can only be set for a type, i.e., for chartWidget or tableWidget, not for scopes or single widgets! - highcharts3dEnabled
Determines whether the 3D display module should be loaded. The default value is false. Set this attribute to true to load the 3D module. - highchartsModulesEnabled
Determines which additional modules should be loaded. The available modules are:- accessibility.js
- annotations.js
- boost.js
- broken-axis.js
- bullet.js
- current-date-indicator.js
- cylinder.js
- data.js
- debugger.js
- drilldown.js
- export-data.js
- exporting.js
- full-screen.js
- funnel.js
- networkgraph.js
- no-data-to-display.js
- offline-exporting.js
- pareto.js
- series-label.js
- solid-gauge.js
- sonification.js
- static-scale.js
- sunburst.js
- tilemap.js
- timeline.js
- treemap.js
- variable-pie.js
- variwide.js
- vector.js
- venn.js
- windbarb.js
- wordcloud.js
- xrange.js
- labels
HTML labels that can be positioned anywhere in the chart area (http://api.highcharts.com/highcharts#labels).labels = "items: [{html:'sometext', style: { left: '100px'; }}]"
- lang
Language object. The language object is global and it can't be set on each chart initiation (http://api.highcharts.com/highcharts#lang). Can only be set for a type, i.e., for chartWidget or tableWidget, not for scopes or single widgets! - legend
The legend is a box containing a symbol and name for each series item or point item in the chart (http://api.highcharts.com/highcharts#legend). - loading
The loading options control the appearance of the loading screen that covers the plot area on chart operations (http://api.highcharts.com/highcharts#loading) - localization
Localized values, i.e., de: {subject:'Thema', yes:'Ja'}, en: {subject:'Subject', yes:'Yes'}. - navigation
A collection of options for buttons and menus appearing in the exporting module (http://api.highcharts.com/highcharts#navigation). - noData
Options for displaying a message like "No data to display" (http://api.highcharts.com/highcharts#noData). - pane
Applies only to polar charts and angular gauges. This configuration object holds general options for the combined X and Y axes set (http://api.highcharts.com/highcharts#pane). - plotOptions
The plotOptions is a wrapper object for config objects for each series type (http://api.highcharts.com/highcharts#plotOptions). - series
The actual series to append to the chart (http://api.highcharts.com/highcharts#series). - subtitle
The chart's subtitle (http://api.highcharts.com/highcharts#subtitle). - title
The chart's main title (http://api.highcharts.com/highcharts#title). - tooltip
Options for the tool tip that appears when the user's mouse hovers over a series or point (http://api.highcharts.com/highcharts#tooltip). - visible
Indicates whether the widget is shown. - xAxis
The X axis or category axis (http://api.highcharts.com/highcharts#xAxis). - yAxis
The Y axis or value axis (http://api.highcharts.com/highcharts#yAxis).
Example of a Chart Widget
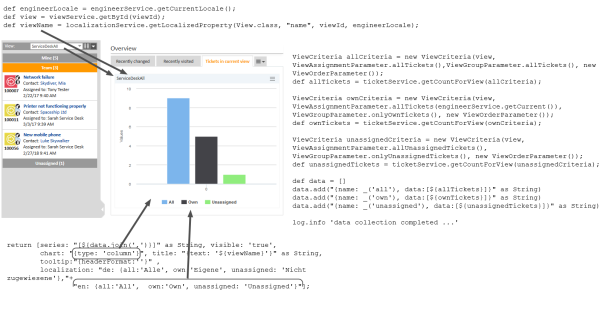
The following example shows the widget TicketsInView and explains the logic of the associated Admin Tool script ticketsInViewDataWidget.groovy. For the entire script, please see the code block above (Configuration Script for Widgets). Here, the lines of code are set in relation to the GUI elements which they configure.
Figure 286: Chart widget example with script code
Funnel Charts
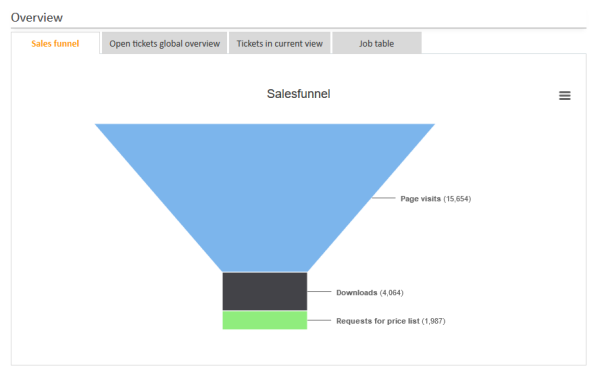
With charts of type funnel, funnel-like representations can be implemented as often used in sales funnels.
A funnel chart is implemented in the same way as other charts, only the sub-attribute type of the chart attribute has to be set to funnel. The following example shows a sales funnel chart implementation where fixed numbers are used in the script. Of course, in a real life implementation, these figures will have to be replaced by figures which are created dynamically from the current content of the database.
Figure 287: ConSol CM Web Client - Sales funnel widget
The following script is used:
return [title: "{text: _('title')}",
chart: "{type: 'funnel', \
marginLeft: '50', \
marginRight: '150'}",
plotOptions: "{series:{ height: '90%', \
width: '85%', \
neckWidth: '20%', \
neckHeight: '20%', \
dataLabels: {enabled:'true', \
format: '<b>{point.name}</b> ({point.y:,.0f})', \
softConnector: 'true'}}}",
visible: "true",
series: "[{name: _('users'), \
data: [[_('visits') , 15654], \
[_('downloads'), 4064], \
[_('requests') , 1987]]}]",
localization: "de: {title: 'Vertriebstrichter', \
users: 'Individuelle Benutzer', \
visits: 'Seitenaufrufe', \
downloads: 'Downloads', \
requests: 'Anfrage Preisliste'}, \
en: {title: 'Salesfunnel', \
users: 'Unique users', \
visits: 'Page visits', \
downloads: 'Downloads', \
requests: 'Requests for price list'}"
]
Code example 33: Groovy script for the implementation of a sales funnel chart on the Web Client Dashboard (with fixed numbers as example)

