Page Customizations for the Visualization of Relations, Expert
Introduction
The Standard configuration of graph displays for relations (see section Page Customizations for the Visualization of Relations, Standard) offers the possibility to configure graph displays in relations sections of ticket, customer, and resource pages, i.e., it extends the functionality of sections which are already present in the respective pages and adds the option to have the graph view displayed.
In addition to that, a whole new section can be included in:
- ticket pages
- contact pages
- company pages
- resource pages (if CM/Resource Pool is active)
This section is hidden in standard installations and can be used to display an individual relation graph which is completely system-specific. The graph is based on a script. There are no other possibilities to configure the content and appearance of the graph! It has to be done in an Admin Tool script.
Please note that that means:
You, as a script developer, are free to include everything which is required, since a script can make use of the entire ConSol CM Java/Groovy API.
You, as a script developer, are fully responsible for the content which is displayed.
The following example will show you how to implement a system-specific relations graph in the resource page. The same principle of cause applies to ticket, contact, and company pages.
Page Customization Example (Expert): New Section in Resource Page
The following steps have to be performed in order to implement a system-specific relations graph in the resource page:
- Step 1: Make the required section visible in the page
- Step 2: Configure the page customization attributes for the newly displayed section
- Step 3: Write the script
- Step 4: Check the result
Step 1: Make the required section visible in the page
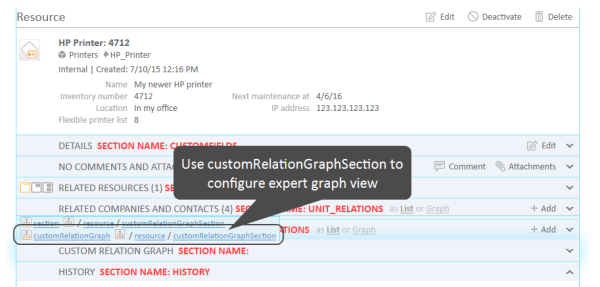
The section which has to be displayed is named customRelationGraphSection. Since the section is not yet displayed, you cannot select it in page customization mode directly on the page, but you have to use the Page Customization tree.
Figure 305: One set of page customization attributes for the customRelationGraphSection
Set the attribute state to either collapsed or expanded. Then the section will be available on the page, in the example on the resource page. The default name/header of the new section is Custom relation graph. The section is displayed above the history section. No graph is displayed yet - if you look at the section in the Web Client, an error will be displayed, because there is no script yet which defines the respective graph.
Step 2: Configure the page customization attributes for the newly displayed section
In order to configure the content and appearance of the graph, you first have to set the page customization attributes for the new section. Select the section either on the page or in the Page Customization tree.
Figure 306: ConSol CM Web Client - Selection of page customization scope for customRelationGraph in resource page
Figure 307: Page customization tree and attributes for customRelationGraphSection
Two attributes are available:
- graphScriptName - String. Refers to a script which is stored in the Admin Tool Scripts and Templates section. In the script, the relations graph can be built based on complex information. For example, it is possible to include data from other CM objects and/or from other systems which might provide CM-relevant data. The script has to be of script type Relation graph and always has to return an object of class RelationGraph. For a detailed explanation of this type of scripts, please refer to section Configuring the Graph Display of Relations Using Scripts.
- sectionHeader - String. Will be displayed in the Web Client as header of the section. Use any String.
- sectionHeight - Integer. Enter the desired height (in pixels) for the relation graph section. The value 0 means that the standard height is used.
Step 3: Write the script
The graphScriptName has to refer to a script of type Relation graph which is stored in the Scripts and Templates section of the Admin Tool. For a detailed explanation of this type of scripts, please refer to section Configuring the Graph Display of Relations Using Scripts.
In the current example, the following values were set for the attributes:
- sectionHeader = This device within the entire infrastructure
- graphScriptName = showGraphicalRelationsOfResource2.groovy
The following script is used:
import com.consol.cmas.common.model.relation.*
//create criteria using java api
def relationCriteria = new RelationCriteria()
.withResourceTickets(new RelationCriteria.ResourceTickets()
.withMaximumStepsFromRoot(2))
.withTicketResources(new RelationCriteria.TicketResources()
.withMaximumStepsFromRoot(2))
.withResourceUnits(new RelationCriteria.ResourceUnits()
.withMaximumStepsFromRoot(2))
.withResourceResources(new RelationCriteria.ResourceResources()
.withMaximumStepsFromRoot(2));
//variables available in script: ticketId, unitId, resourceId (depending on page)
def resource = resourceService.getById(resourceId)
def relationGraph = relationService.load(resource, relationCriteria);
//modify graph nodes, edges and visjs property
for (RelationNode node : relationGraph.getNodes()) {
node.withProperty("font", [size:9,color:"black"]) //change default property
}
for (RelationEdge edge : relationGraph.getEdges()) {
edge.withProperty("font", [size:12, color:"red"]); //change default property
}
relationGraph.withProperty("layout", [improvedLayout:true]) //change default property
return relationGraph;
Code example 43: Script for customRelationGraph , showGraphicalRelationsOfResource2.groovy
Step 4: Check the result
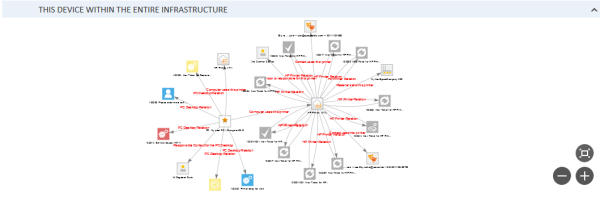
The following graph is displayed in the Web Client:
Figure 308: ConSol CM Web Client - Display of expert relation graph in the resource page


