Page Customizations for the Visualization of Relations, Standard
Introduction
In all sections which represent relations (see section Configuration of the Graphical Display in Standard Mode), it is possible to configure the ConSol CM Web Client to offer - besides the list view - a graph view of the relations. This is done using page customization.
You can only switch on the graph view and use the default settings, this is a very simple step. Or you can go ahead and configure a more complex configuration.
The following example shows how to configure the display of relation graphs in a ticket page. Since CM/Resource Pool is active, the example comprises the configuration of ticket-resource relations as graph. The same principle as shown for a
- ticket page
applies to
- a company page
- a contact page
- a resource page (available if CM/Resource Pool is active)
Page Customization Example (Standard): contactSection in Ticket Page
Start with Page Customization of Contact Section in Ticket Page
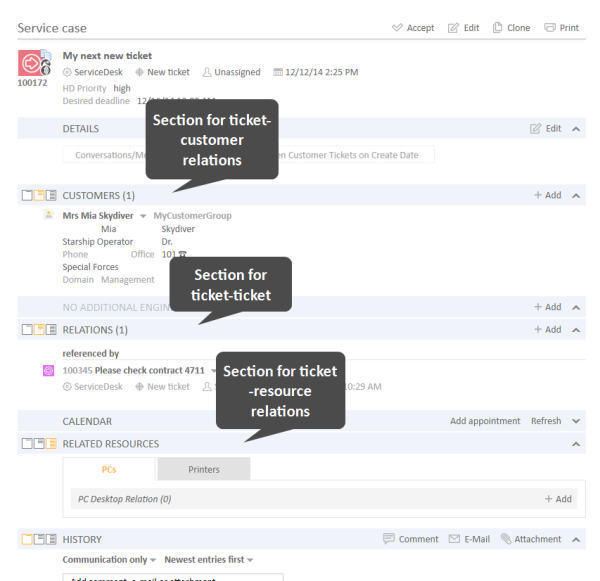
In a ticket page, there are three sections where relations can be displayed.
Figure 298: ConSol CM Web Client - Ticket page: Sections where relations are displayed
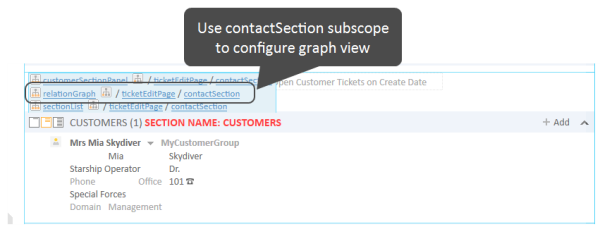
For each of the sections, the graph display can be configured separately. For example, start with the customer relations section. Log in as engineer with administrator privileges and Enable page Customization (main menu). For the customer relations sections several page customization scopes and subscopes are offered. Use the section-specific subscope to configure the graph. For the customer relations section, this is the contactSection subscope.
Figure 299: ConSol CM Web Client - Selection of page customization scope for relationGraph in contactSection
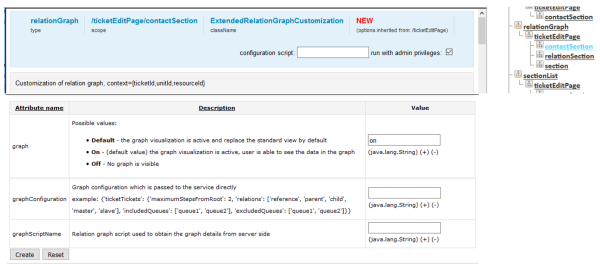
You can also select the subscope contactSection section in the Page Customization tree. In either case, the relationGraph configuration page for the contact section is opened (see following figure).
Figure 300: Page customization of contact section in ticket edit page
Attributes for Page Customization of Standard Relations Graph View
The following attributes are available:
- graph - String. Possible values:
- Default - the graph visualization is active and replace the standard view by default
- On - (default value in new installations) the graph visualization is active, user is able to see the data in the graph
- Off - no graph is visible
- graphConfiguration - String, JSON statement
With this JSON statement, you can configure the appearance of the graph. A default value is defined implicitly in the system, so when you just switch on the graph display, you do not have to define a graphConfiguration. But you can use it, if the default configuration does not cover the required display. For a detailed explanation, please see section Configuring the Graph Display of Relations Using JSON Statements.
- graphScriptName - String
Refers to a script which is stored in the Admin Tool Scripts and Templates section. In the script, the relations graph can be built based on complex information. For example, it is possible to include data from other CM objects and/or from other systems which might provide CM-relevant data. The script has to be of script type Relation graph and always has to return an object of class RelationGraph. For a detailed explanation of this type of scripts, please refer to section Configuring the Graph Display of Relations Using Scripts.
- sectionHeight - Integer
Enter the desired height (in pixels) for the relation graph section. The value 0 means that the standard height is used.
Please provide either a graphConfiguration or a graphScriptName. In case, both are provided, the script is the one which will be used. The graphConfiguration is not taken into account in this case.
Simple Example Using graphConfiguration
The following example configuration is used for a first explanation of how the graphConfiguration attribute works.
In the contactSection (see figures above), the following values are set for the attributes:
-
graph: on
-
graphConfiguration:
{"ticketCustomers" :
{"maximumStepsFromRoot" : 2,
"relations":["main","default","end customer"],
"includedCustomerGroups":["Reseller","MyCustomerGroup"]}
}
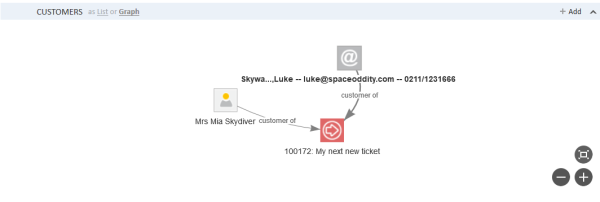
This results in the following graph display:
Figure 301: ConSol CM Web Client - Ticket page: Graph display of customer relations to the ticket
If you change the graphConfiguration as follows
{"ticketCustomers" :
{"maximumStepsFromRoot" : 2,
"relations":["main","default","end customer"],
"includedCustomerGroups":["DirectCustomers","MyCustomerGroup"]}
}
the following graph is displayed:
Figure 302: ConSol CM Web Client - Ticket page: Graph display of customer relations to the ticket, variant
The customer (contact) Luke Skywalker is in the customer group Reseller, and when the customer group Reseller has not been explicitly included, this customer is not displayed in the graph.
This simple example hopefully helps you understand the general principle of the configurationGraph. A detailed explanation of all parameters is provided in section Configuring the Graph Display of Relations Using JSON Statements.
Simple Example Using graphScript
A graphScript always has to return an object of class RelationGraph.
The following simple script will show only ticket-customer relations and could be used in the customer section of the ticket page. In this case, it would be easier to work with the configurationGraph, however, we want to show you how a script works ...
import com.consol.cmas.common.model.relation.*
//create criteria using java api
def relationCriteria = new RelationCriteria()
.withTicketCustomers(new RelationCriteria.TicketCustomers()
.withMaximumStepsFromRoot(2));
def ticket = ticketService.getById(ticketId)
def relationGraph = relationService.load(ticket, relationCriteria);
return relationGraph;
Code example 41: Simple graphScript
The following graph is displayed:
Figure 303: ConSol CM Web Client - Ticket page: Graph display in the customers section based on the script shown above
If the layout should be changed, the script could be modified as follows.
import com.consol.cmas.common.model.relation.*
//create criteria using java api
def relationCriteria = new RelationCriteria()
.withTicketCustomers(new RelationCriteria.TicketCustomers()
.withMaximumStepsFromRoot(2));
def ticket = ticketService.getById(ticketId)
def relationGraph = relationService.load(ticket, relationCriteria);
for (RelationNode node : relationGraph.getNodes()) {
node.withProperty("font", [size:10,color:"blue"]) //change default property
.withProperty("image", null) //remove default property
.withProperty("shape", "diamond") //remove default property
}
return relationGraph;
Code example 42: Simple graphScript with simple node layout definition
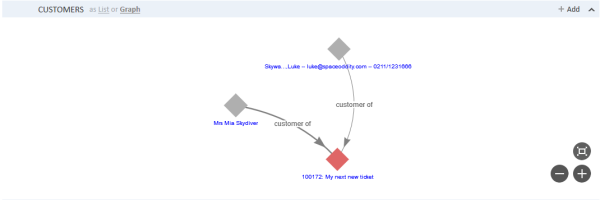
The following graph is displayed:
Figure 304: ConSol CM Web Client - Ticket page: Slightly modified graph in customer relations section, based on the script shown above
In the script shown above, only the appearance of the nodes has been changed. The appearance of the edges also can be modified. Furthermore, there are numerous configuration parameters which can be set. For a detailed explanation, please refer to section Configuring the Graph Display of Relations Using Scripts.
