Chart widgets
Chart widgets are configured in the type chartWidget or one of its subitems. They use the Highcharts library. All attributes are JSON objects.
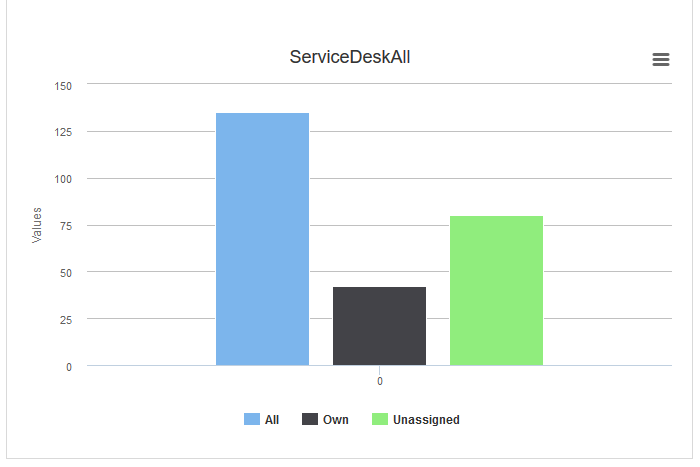
The following figure shows the default chart widget with the number of cases in the current view:
You can provide settings both in the widget script and in the widget settings. The values set in the script overwrite the values entered in the widget settings.
General attributes:
- Development mode (developmentMode)
Boolean. Enables the development mode for the widget. If this attribute is set to true, the widget is displayed with a red border and a JSLint validation is performed on the widget script. If there are errors in the widget script, the error messages are displayed instead of the widget. - 3D display (highcharts3dEnabled)
Boolean. Determines whether the 3D display module should be loaded. The default value is false. Set this attribute to true to load the 3D module.3D rendering requires a lot of browser resources.
- Additional modules (highchartsModulesEnabled)
String. Determines which additional modules should be loaded. The available modules are:- accessibility.js
- annotations.js
- boost.js
- broken-axis.js
- bullet.js
- current-date-indicator.js
- cylinder.js
- data.js
- debugger.js
- drilldown.js
- export-data.js
- exporting.js
- full-screen.js
- funnel.js
- networkgraph.js
- no-data-to-display.js
- offline-exporting.js
- pareto.js
- series-label.js
- solid-gauge.js
- sonification.js
- static-scale.js
- sunburst.js
- tilemap.js
- timeline.js
- treemap.js
- variable-pie.js
- variwide.js
- vector.js
- venn.js
- windbarb.js
- wordcloud.js
- xrange.js
- Localizations (localization)
String. Localized values, i.e., de: {subject:'Thema', yes:'Ja'}, en: {subject:'Subject', yes:'Yes'}. See Localizing widget text. - Visible (visible)
Boolean. Determines whether the widget is shown (true) or not (false).
Highcharts attributes:
- Chart options (chart)
String. Options regarding the chart area and plot area as well as general chart options. Example:chart = "type:'column', pltShadow:false, backgroundColor:'#4dc245', height:300";"items: [{html:'sometext', style: { left: '100px'; }}]"
Code example 35: Chart object
- Colors (colors)
String. An array containing the default colors for the chart’s series. When all colors are used, new colors are pulled from the start again. - Credits (credits)
String. Highchart, by default, puts a credits label in the lower right corner of the chart. - Drilldown options (drilldown)
String. Options for drill down, the concept of inspecting increasingly high resolution data through clicking on chart items like columns or pie slices.In addition to setting the drilldown options, you need to extend the widget script. The data returned by the script must contain the data shown in the drilldown which needs to be linked to the data it extends.
- Export options (exporting)
String. Options for the exporting module. - Language (lang)
String. Language object. The language object is global and applies to all charts. Can only be set for a type, i.e., for chartWidget, not for scopes or single widgets. - Legend (legend)
String. The legend is a box containing a symbol and name for each series item or point item in the chart. - Loading options (loading)
String. The loading options control the appearance of the loading screen that covers the plot area on chart operations. - Navigation options (navigation)
String. A collection of options for buttons and menus appearing in the exporting module. - Message for no data (noData)
String. Options for displaying a message like “No data to display”. - Pane options (pane)
String. Applies only to polar charts and angular gauges. This configuration object holds general options for the combined X and Y axes set. - Plot options (plotOptions)
String. plotOptions is a wrapper object for configuration objects for each series type. - Series (series)
String. The data displayed in the chart. - Subtitle (subtitle)
String. The chart’s subtitle.. - Title (title)
String. The chart’s main title. - Tooltip (tooltip)
String. Options for the tooltip that appears when hovering over a data series or point. - X axis (xAxis)
String. The X axis or category axis. - Y axis (yAxis)
String. The Y axis or value axis.
See https://api.highcharts.com/highcharts/ for details about the available Highcharts attributes.
Coding example
The following example shows the script which is used for the default chart widget showing the number of cases in the current view. The script has to return a HashMap containing the attributes which should be set.
import com.consol.cmas.common.model.ticket.*;
import com.consol.cmas.common.model.ticket.view.*;
import java.util.*;
import java.util.Map.Entry;
if (viewId == -1) {
return [visible: 'false']
}
def engineerLocale = engineerService.getCurrentLocale()
def view = viewService.getById(viewId)
def viewName = localizationService.getLocalizedProperty(View.class, "name", viewId, engineerLocale)
ViewCriteria allCriteria = new ViewCriteria(view,
ViewAssignmentParameter.allTickets(),
ViewGroupParameter.allTickets(),
new ViewOrderParameter())
def allTickets = ticketService.getCountForView(allCriteria)
ViewCriteria ownCriteria = new ViewCriteria(view,
ViewAssignmentParameter.allTickets(engineerService.getCurrent()),
ViewGroupParameter.onlyOwnTickets(),
new ViewOrderParameter())
def ownTickets = ticketService.getCountForView(ownCriteria)
ViewCriteria unassignedCriteria = new ViewCriteria(view,
ViewAssignmentParameter.allUnassignedTickets(),
ViewGroupParameter.onlyUnassignedTickets(),
new ViewOrderParameter())
def unassignedTickets = ticketService.getCountForView(unassignedCriteria)
def data = []
data.add("{name: _('all'), data:[${allTickets}]}" as String)
data.add("{name: _('own'), data:[${ownTickets}]}"as String)
data.add("{name: _('unassigned'), data:[${unassignedTickets}]}"as String)
return [series: "[${data.join(',')}]" as String,
visible: 'true',
chart: "{type: 'column'}", title: "{text: '${viewName}'}" as String,
tooltip:"{headerFormat:''}" ,
localization:"de: {all:'Alle',own:'Eigene',unassigned:'Unzugewiesene'},"+ "en: {all:'All', own:'Own', unassigned: 'Unassigned'}"];
Code example 36: Script for the default chart widget ticketsInViewDataWidget.groovy
The type of chart can be modified in the type sub-attribute of the chart attribute. There is a large number of available chart types, see https://api.highcharts.com/highcharts/plotOptions.
The following figure shows a chart of the type funnel:
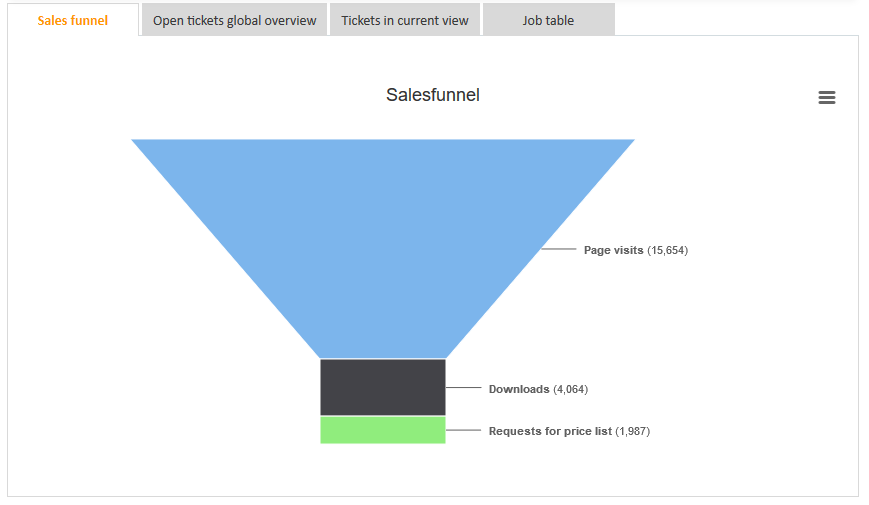
The following code example demonstrates the basic principle of the implementation of a funnel widget. Some static data is used for demo purposes.
return [title: "{text: _('title')}",
chart: "{type: 'funnel', \
marginLeft: '50', \
marginRight: '150'}",
plotOptions: "{series:{ height: '90%', \
width: '85%', \
neckWidth: '20%', \
neckHeight: '20%', \
dataLabels: {enabled:'true', \
format: '<b>{point.name}</b> ({point.y:,.0f})', \
softConnector: 'true'}}}",
visible: "true",
series: "[{name: _('users'), \
data: [[_('visits') , 15654], \
[_('downloads'), 4064], \
[_('requests') , 1987]]}]",
localization: "de: {title: 'Vertriebstrichter', \
users: 'Individuelle Benutzer', \
visits: 'Seitenaufrufe', \
downloads: 'Downloads', \
requests: 'Anfrage Preisliste'}, \
en: {title: 'Salesfunnel', \
users: 'Unique users', \
visits: 'Page visits', \
downloads: 'Downloads', \
requests: 'Requests for price list'}"
]
Code example 37: Script for a sales funnel chart with demo data