The Web Client Dashboard is configured using Page Customization.
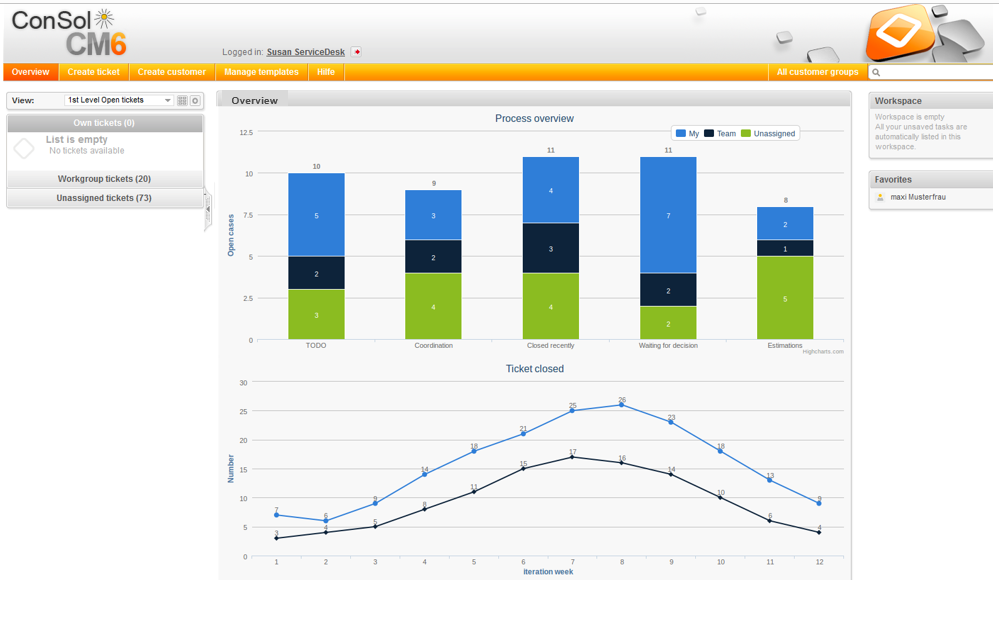
Figure 114: ConSol CM Web Client - Web Client Dashboard with chart widgets
Log in as admin, open the Overview page and select Enable page customization in the main menu. The following (Dashboard-relevant) elements can be configured here:
As explained before in section Page Customization each of the three elements is represented by a subtree in the page customization tree. The following figure provides an example page customization tree with subtrees relevant for the Web Client Dashboard. A detailed explanation is provided in the following sections.
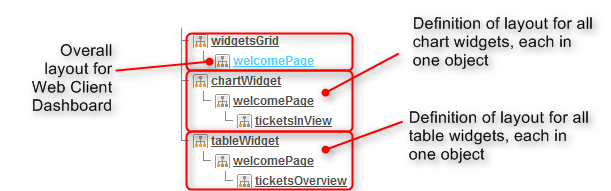
Figure 115: ConSol CM Web Client - Page customization subtrees for Web Client Dashboard layout
The overall layout of the entire Web Client Dashboard is defined using the page customization attribute widgetsGrid / welcomePage.
Attributes:
The following figures show the organization of an example grid and its representation in the page customization.
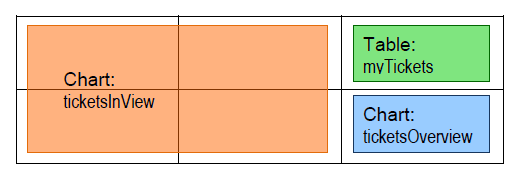
Figure 116: Organization of an example grid of a welcomePage
The value of the respective layout attribute would be:
[ticketsInView:Chart, ticketsInView, myTickets:Table], [ticketsInView, ticketsInView, ticketsOverview:Chart]
Each chart widget and each table widget has a configuration script. This script is a Groovy script which is stored in the Scripts section of the Admin Tool and is referenced by its name. The scripts has to be of type Page customization. Select the widget in the PCDS and enter the script name:
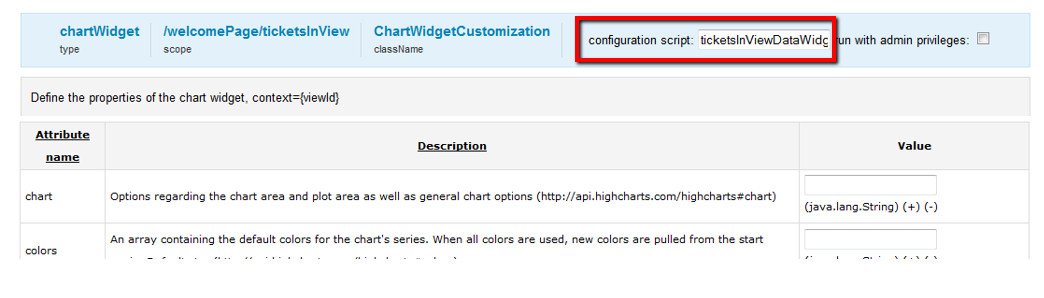
Figure 117: ConSol CM Web Client - Script definition for a chart widget
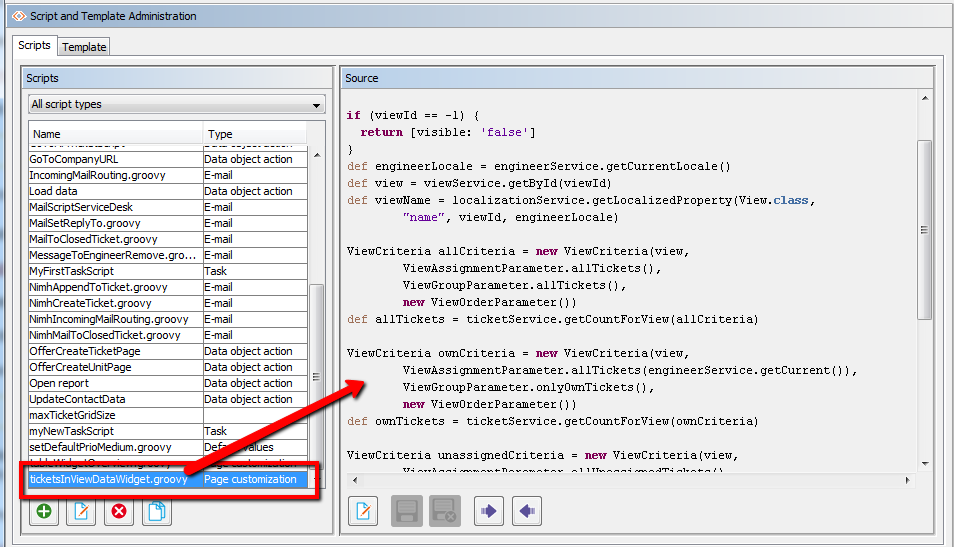
Figure 118: ConSol CM Admin Tool - Admin Tool script for a widget of the Web Client Dashboard
The configuration script of a widget is the place where the statements are defined which retrieve the required data from the CM system and where the widget layout is defined. The execution of this groovy script is a core part of the customization. The script must return a map of variables which correspond to the defined widget properties.
An incorrect script does not provide a data structure which can be displayed by the Web Client Dashboard. Since the Dashboard is displayed on the Overview page which is the start page, the Web Client will not start in those cases! Disable or comment out the script to start the Web Client again.
The script overwrites the configuration data provided in the page customization. The values are not merged! The script will thus override any widget attribute value set in the customization, so please make sure that the desired attribute is not set within the script if you want to use the page customization for attribute setting.
A script which is associated with a widget is usually executed with user (= engineer) permissions, e.g., the standard chart widget shows a graphical representation of the selected view. However, sometimes values have to be used which are not available in the engineer context, e.g., escalated tickets (of all engineers) in a certain queue. In order to execute a script with admin permissions, select the check box run with admin privileges. Please keep in mind that the results of the Java or Groovy methods which retrieve the data will vary depending on the context. For example, the method ticketService.getAll() will return only tickets for which the current engineer has at least read permissions, but will return all tickets in the system when executed as admin.
The chart representation in the Web Client Dashboard is based on the Highcharts library. Thus, for chart widgets, the Admin Tool script has to return a HashMap containing the attributes which should be set (see return statement in the code example below which uses the attributes series, visible, chart, title, tooltip, and localization). A detailed explanation of all attributes and the respective hyperlinks is provided in the section Attributes for Chart Widgets.
The table representation in the Web Client Dashboard is based on the Datatables library. Thus, for table widgets, the Admin Tool script has to return a HashMap containing the attributes which should be set. Please see section Attributes for Table Widgets.
Very complex scripts can decrease system performance!
The following example shows the script ticketsInViewDataWidget.groovy which is provided with a standard ConSol CM distribution.
import com.consol.cmas.common.model.ticket.*;
import com.consol.cmas.common.model.ticket.view.*;
import java.util.*;
import java.util.Map.Entry;
if (viewId == -1) {
return [visible: 'false']
}
def engineerLocale = engineerService.getCurrentLocale()
def view = viewService.getById(viewId)
def viewName = localizationService.getLocalizedProperty(View.class, "name", viewId, engineerLocale)
ViewCriteria allCriteria = new ViewCriteria(view,
ViewAssignmentParameter.allTickets(),
ViewGroupParameter.allTickets(),
new ViewOrderParameter())
def allTickets = ticketService.getCountForView(allCriteria)
ViewCriteria ownCriteria = new ViewCriteria(view,
ViewAssignmentParameter.allTickets(engineerService.getCurrent()),
ViewGroupParameter.onlyOwnTickets(),
new ViewOrderParameter())
def ownTickets = ticketService.getCountForView(ownCriteria)
ViewCriteria unassignedCriteria = new ViewCriteria(view,
ViewAssignmentParameter.allUnassignedTickets(),
ViewGroupParameter.onlyUnassignedTickets(),
new ViewOrderParameter())
def unassignedTickets = ticketService.getCountForView(unassignedCriteria)
def data = []
data.add("{name: _('all'), data:[${allTickets}]}" as String)
data.add("{name: _('own'), data:[${ownTickets}]}"as String)
data.add("{name: _('unassigned'), data:[${unassignedTickets}]}"as String)
return [series: "[${data.join(',')}]" as String,
visible: 'true',
chart: "{type: 'column'}", title: "{text: '${viewName}'}" as String,
tooltip:"{headerFormat:''}" ,
localization:"de: {all:'Alle',own:'Eigene',unassigned:'Unzugewiesene'},"+ "en: {all:'All', own:'Own', unassigned: 'Unassigned'}"];
Code example 3: Standard ConSol CM chart widget script ticketsInViewDataWidget.groovy
The following chart is defined by the script above. For a detailed explanation, please refer to the section Example of a Chart Widget.
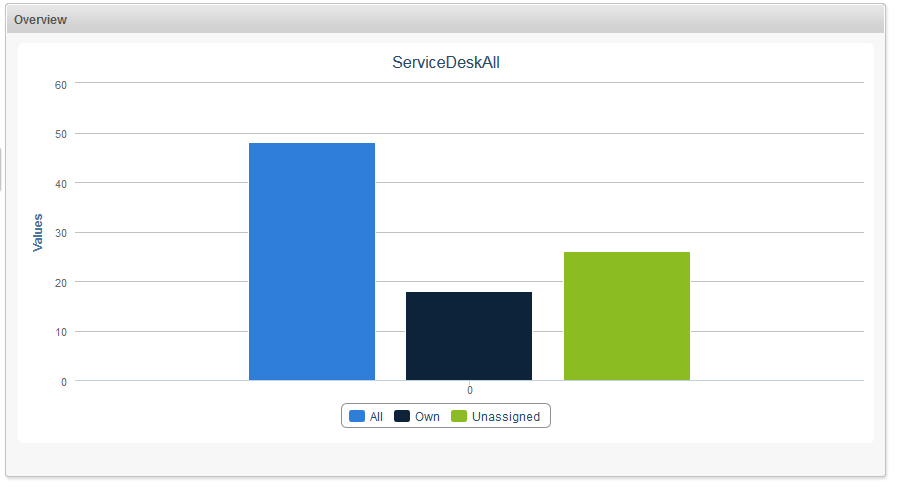
Figure 119: ConSol CM Web Client - Example chart widget